


Imagine you’re trying to decide whether to hop on a roller coaster. You’d want to know if it’s a gentle ride or a thrilling one. In the world of trading, the Average Directional Index (ADX) acts like that roller coaster indicator. It measures the strength of a trend, telling you whether the market is moving in a clear direction or meandering sideways. Just like a roller coaster ride, a strong trend can lead to significant gains, but it also comes with higher risk. So, knowing the ADX value can help you make informed trading decisions.
What is the ADX indicator?
The ADX indicator merely determines whether we are in a trading or non-trading phase and how strong a trend is. Stated differently, the ADX serves as a trend strength indicator. Strong downtrends and buy signals are detected using this technique of technical analysis.
Fortunately, most charting software automatically calculates the ADX, eliminating the need for manual computations. Users simply apply the ADX indicator to a chart, and the software performs the necessary calculations based on the chosen time frame. The default time period for the ADX is 14, but it can be customized to suit individual trading strategies.
ADX Trading Strategy
The guidelines of the ADX indicator method will make sure that you trade only when the daily chart shows a strong trend. From this perspective, the optimal ADX approach is a universal method that exhibits consistent performance across all time frames.
Step 1: Verify Trend Strength with the ADX Indicator
Before attempting to predict market direction, it’s crucial to confirm the existence of a strong trend using the ADX indicator. A reading above 25 on the ADX indicator signifies a robust trend and the potential for further directional movement.
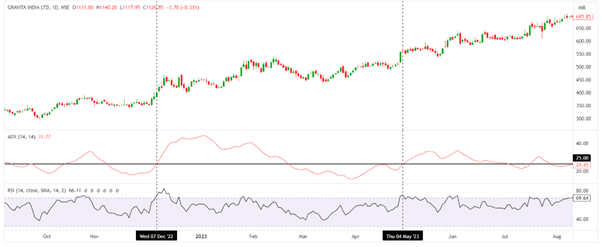
As shown in the above chart of Gravita India, the ADX is crossing above the 25 level on December 7, 2022, and May 4, 2023. Here, we are hunting for buying opportunities.
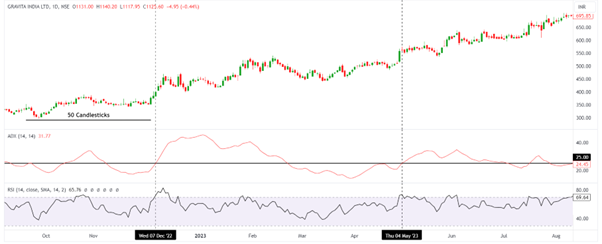
Step 2: To enter into the trade, we need to spot a price with an uptrend; at least 50 trading sessions must be in a trend.
As we are trading into momentum, we need a strong trend to be in our favour. So, to keep it simple, we will look for the price to move above 50 candlesticks to spot the trend and enter the trend. This is not an actual trade entry; we need more confirmation.
Step 3: Buy the stock when the RSI breaks the level of 70.
When the stock RSI crosses the level of 70 and enters the overbought region, that is the opportunity to trade the stock and ride the trend with the bulls of the market.
Here we are just sitting on the wave of bullish sentiment without deep diving into the analysis.
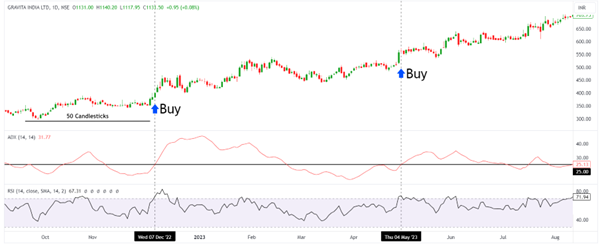
In the above-given chart of Gravita India, we see there are two buy signals generated by ADX in conjunction with RSI.
Check: RSI Trading Strategies
Step 4: Stop loss to be at a prior higher

The stop-loss order must be followed for every trading strategy. For this specific strategy, the stop loss should be placed at a prior high of ADX before the entry of trade, as shown in the below chart.
Step 5: Profit booking on fading the trend, retracement of ADX at 25
To book profit booking with this strategy, the same indicator is used. The trend fades away after a huge buying action and the strength of the trend declines. The ADX returns to the lower level, where it crosses the level of 25 again downward. This is the right time to book the profit. The same is shown in the chart below.
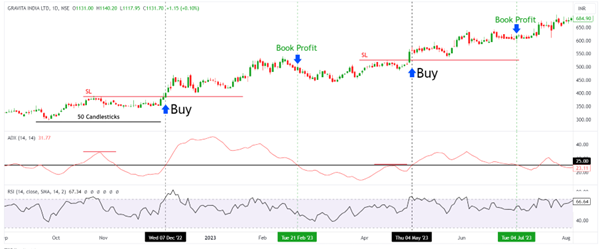
As shown in the above chart of Gravita India, the profit booking points are marked on February 21, 2023, and July 4, 2023.

