


RSI, a momentum oscillator, quantifies the rate of change in up and down days, providing values on a 0-100 scale. Higher values signal overbought conditions, while lower values indicate oversold conditions, making RSI a key tool in market analysis.
Calculation of RSI
The RSI indicator operates by assessing two distinct metrics:
The first metric considers price gains on upward-closing days, where an up day signifies a close higher than the previous day.
The second metric accounts for price losses on downward-closing days, where a down day denotes a close lower than the previous day.
The RSI then compares the relative strength of these metrics and is computed as follows:
RSI = 100 – [100 / (1 + RS)]
Here, RS corresponds to the average of all positive changes observed during the defined look-back period, divided by the average of all negative changes.
RSI Basics
Typically, traders implement a straightforward approach by utilizing RSI threshold values for decision-making. The common thresholds are 70, signalling overbought conditions, and 30, indicating oversold conditions. When RSI breaches these thresholds, it triggers actions. In the illustration below, you can observe the moments when RSI crosses these overbought and oversold thresholds, depicted within the purple range spanning from 30 to 70.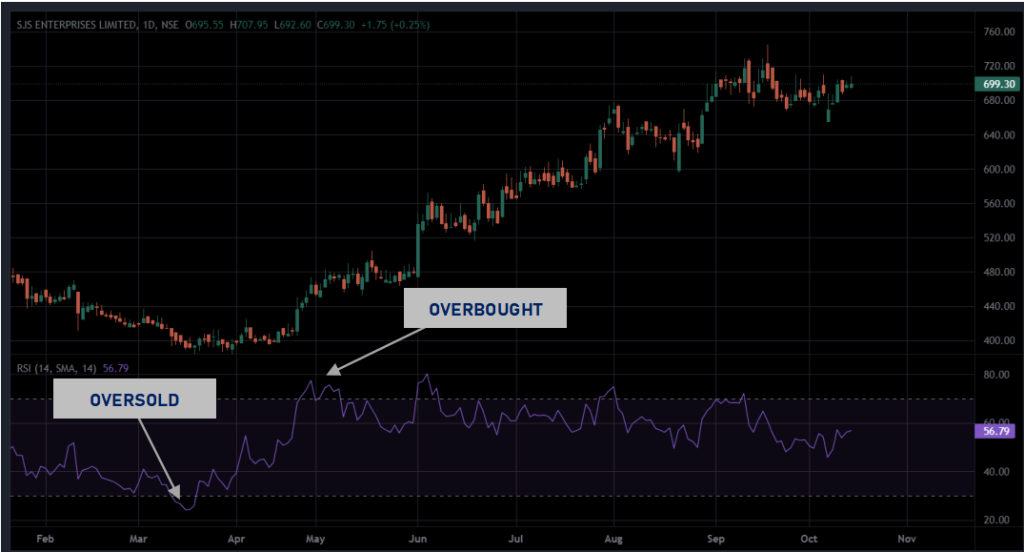 You have the flexibility to modify the RSI inputs within the settings tab


RSI Trading Strategies
Buy Low, Sell High
One of the most commonly advocated trading strategies online is the “Buy Low, Sell High” approach. While it holds some merit, it may not be robust enough for widespread adoption.
The premise is straightforward: Initiate a trade when the RSI falls below 30, signifying an oversold condition, and exit the position when the RSI surpasses 70, indicating an overbought state.
This strategy involves patiently waiting for a market pullback, capitalizing on the anticipation of an imminent correction that will propel the security to new heights. Below, we present an illustrative example of a successful trade executed based on this rationale.

| Man Infra Share – Returns: 46% | |
| BUY Price | Rs. 66 |
| EXIT Price | Rs. 95.8 |
Utilizing Previous RSI Extremes (Breakout)
In this strategy, we focus on past RSI highs and lows to identify key levels. These levels serve as critical junctures where, if breached, the security is likely to maintain its short-term trend direction.
By examining these historical RSI extremes, we gain valuable insights into potential breakout points. When the RSI surpasses a previous high or falls below a prior low, it signifies a compelling trading opportunity based on the continuation of the prevailing trend. This approach leverages historical RSI data to inform trading decisions, enhancing the trader’s ability to catch trend-following moves.
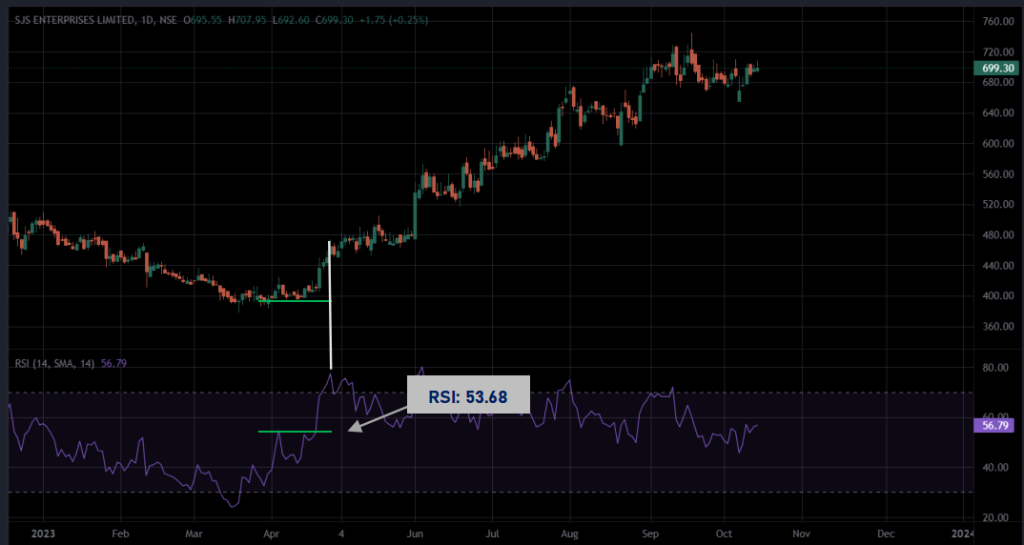
| SJS Share – Returns: 17% | |
| BUY Price | Rs. 402.1 |
| EXIT Price | Rs. 471.9 |
Limitations and Potential Drawbacks of the RSI Indicator
Overbought and Oversold Conditions
While RSI is instrumental in identifying overbought and oversold levels, it’s vital to acknowledge that securities can persist in these states for extended durations, and prices may continue their ascent or descent despite extreme RSI readings. Solely relying on RSI signals for entry and exit points can result in missed opportunities or premature actions.
False Signals
Like all technical indicators, RSI is not infallible and can produce false signals. These signals arise when RSI suggests a trend reversal or continuation, but market prices defy these indications. Depending solely on RSI without considering corroborating factors can lead to losses.
Lack of Price Context
RSI exclusively considers price movements, disregarding other pivotal factors such as volume, market sentiment, or significant news events. It is imperative to encompass a broader market context, complementing RSI with other technical indicators or fundamental analysis for validation.
Lagging Indicator
RSI operates as a lagging indicator, deriving its calculations from historical price data. This characteristic renders it less responsive to swift market changes, potentially resulting in delayed signal generation, particularly in volatile markets.
Divergence Misinterpretation
While RSI divergence can be influential, it can also be misinterpreted. Divergence signifies a potential reversal when price and RSI move in opposite directions. Yet, not all divergences culminate in trend reversals, necessitating the use of additional indicators or patterns for confirmation.
Market Conditions
RSI’s effectiveness is contingent on market conditions. In trending markets, it can remain in overbought or oversold zones for extended periods, leading to false signals. Conversely, in range-bound markets, RSI may frequently generate buy and sell signals due to price oscillations.
Individual Security Characteristics
Each security exhibits distinctive behaviours. RSI may perform admirably with certain stocks or markets while being less effective with others. Understanding a security’s unique attributes and conducting comprehensive analysis beyond RSI is indispensable for informed trading decisions.
Conclusion
In conclusion, the Relative Strength Index (RSI) is a versatile and powerful tool that can assist traders and investors in navigating the complex world of financial markets. By employing strategies such as the 70/30 rule and paying close attention to overbought and oversold conditions, RSI can help traders make informed decisions. Additionally, RSI’s role in trend analysis is invaluable, providing insights into trend strength and potential reversals, and ultimately enhancing traders’ ability to achieve success in the markets.
Disclaimer: This blog has been written exclusively for educational purposes. The securities mentioned are only examples and not recommendations. It is based on several secondary sources on the internet and is subject to changes. Please consult an expert before making related decisions.

