


")
Candlestick patterns are a powerful tool in the world of technical analysis for understanding and predicting price movements in the stock market. These patterns, which have their roots in eighteenth-century Japan, provide traders and investors with valuable insights into market sentiment and potential price reversals.
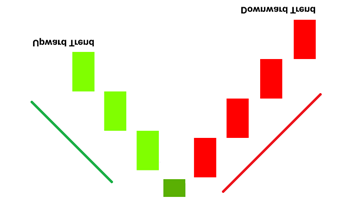
Candlestick patterns are a visual representation of price movements in each timeframe, say a day, week, or month. Each candlestick consists of a rectangular “body” and “wicks” or “shadows” on either side. The body represents the opening and closing prices, while the shadows indicate the high and low prices during that period.
Furthermore, it can be broadly categorized into two main groups: bullish patterns, which signal potential price increases, and bearish patterns, which indicate possible price declines. In this article, let’s explore the three most popular patterns in each category, starting with the bullish patterns.
Bullish Patterns
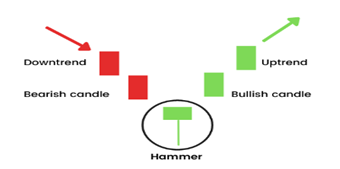
- Hammer: The hammer candlestick pattern is quite unique. It has a short body with a long lower wick and is typically spotted at the end of a downtrend. The hammer suggests that even though there was a lot of selling going on during the day, a powerful force of buyers managed to push the price back up. The body of the candle can be green or red, but if it’s green, it’s a sign of an even stronger bullish market compared to a red one.
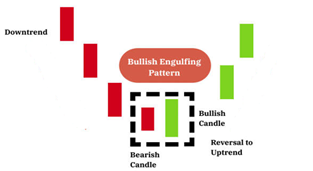
- Bullish Engulfing: The bullish engulfing pattern is made up of two candles. The first one is a small red candle, and it is entirely covered by a bigger green candle. Even though the second day starts with a lower price than the first day, the bullish market takes control and pushes the price higher, making it a clear victory for the buyers.
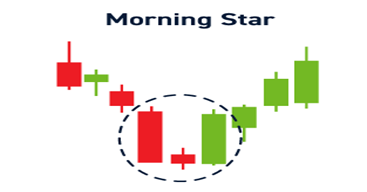
- Morning Star: The morning star candlestick pattern is often seen as a ray of hope during a gloomy market downtrend. This pattern consists of three candles: a short-bodied candle sandwiched between a long red one and a long green one. Traditionally, the ‘star’ candle has no overlap with the longer bodies, and both the open and closed prices create gaps. This pattern signals that the intense selling pressure from the first day is starting to ease, suggesting that a bullish trend may be emerging on the horizon.
Bearish Patterns
- Shooting Star: The shooting star, which resembles an inverted hammer, is a candlestick pattern formed within an uptrend. It features a small lower body and a long upper wick. Typically, the market opens with a slight gap to the upside, experiences a rally to an intra-day high, and then closes at a price just above the opening level, resembling a star falling to the ground. This pattern often indicates a potential reversal from the uptrend.

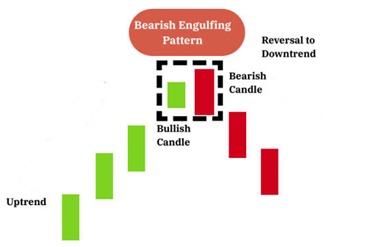
- Bearish Engulfing: The bearish engulfing pattern usually shows up when an uptrend is about to end. It starts with a small green candle, and then a big red candle comes along and completely covers the green one. This pattern tells us that the price might be hitting a high point or slowing down, and it’s a sign that the market might be getting ready to head down. The bigger the red candle is compared to the green one, the stronger the upcoming downward trend might be.
- Evening Star: The evening star is like the opposite of the morning star, and it’s made up of three candles. First, there’s a long green candle, then a short one, and finally, a big red one. This pattern shows that an upward trend might be changing, and it’s quite powerful when the third candle wipes out the gains from the first one.
Disclaimer: This blog has been written exclusively for educational purposes. The securities mentioned are only examples and not recommendations. It is based on several secondary sources on the internet and is subject to changes. Please consult an expert before making related decisions.

