


TradingView is a powerful charting and analysis platform for traders and investors. It offers real-time charting, hundreds of technical indicators, advanced back-testing, customizable layouts, collaborative features, and trading integration. TradingView is popular for its ease of use and powerful features. The huge and growing TradingView community allows you to talk to millions of traders, ranked so you can learn from the most followed traders. This feature alone can be a game-changer for your trading.
How to get Started with TradingView?
For TradingView there is no need to log in with a broker or to download any file. Just open a TradingView Account by following the below procedure:
- Open the website TradingView.com and click on Sign In,
- Sign Up & Sign In,
- Once you confirm your account just log in and explore,
- You will see the overview of each feature paid and free,
Understanding User Interface
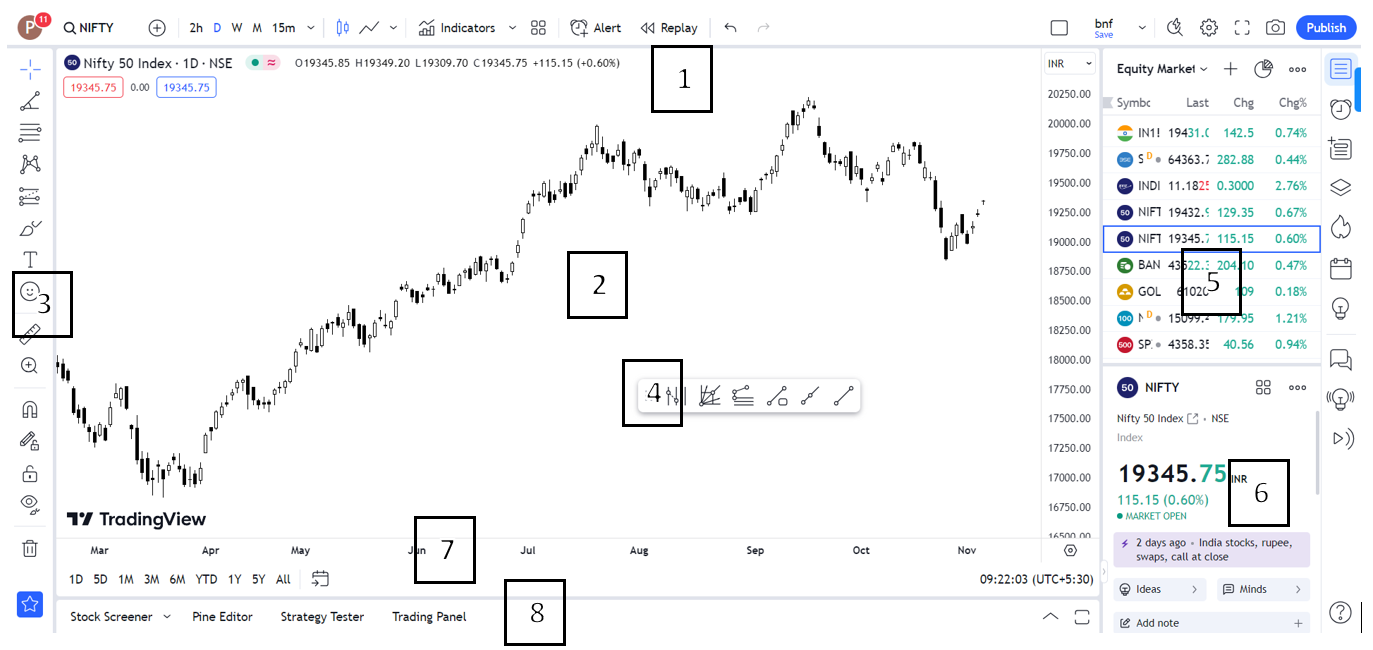
- Top Menu: Basic options for changing the chart, like switching pairs, timeframes, chart types, indicators, strategies, alerts, etc.
- Chart Area: Where you see the price of the instrument.
- Left Side Menu: Drawing tools, like rectangles, lines, and Fibonacci retracements.
- Drawing Tools (Floating Bar): Optional floating toolbar that helps you bring all important and favourite tools for quick access and use.
- Watchlist and Quote Area: See your watchlist and quotes.
- Right Side Menu: Social options and trading tools, like the calendar and alerts box.
- Bottom Sub-Menu: Convert the timeframe of the chart and access any data.
- Bottom Menu: Advanced research and help, where you can build, test strategies, create notes, and more.
Top Menu

-
- Basic Account details
- Script Name (Direct search Symbol) – Use exchange code to search specific scrip for ex, NSE, BSE
- Time Frame – You can use various timeframes For example, 1,3,5,15,30,45 Minutes, 1, 2, 3 & 4 Hours & 1 Day, 1 Week, 1 Month
- Type of Chart – In TradingView there are many types of charts you can use like Candlestick, Heikin Ashi, Renko, Line, etc. and also you can mark them as your favourite one by clicking on a star.
- Compare – This is used for comparing 2 or more charts, In the end of this guide this tool is explained in detail.
- Indicators – This tool allows you to use the various indicators in-built and customised as there is one more tool to create indicators and strategy known as Pine Editor. At the end of this article, it is explained in detail.
- Fundamental Metrics – By clicking on this button you can plat financial data on the chart on new pane of selected Scrip
- Templates – In this you can save your favourite combination of chart price and indicators.
- Alert (Alt + A) – It is the best feature of TradingView that when the price reaches a certain level you put an alert on it makes a sound and saves trader trader from losses, making him/her aware about stock price movements saving his/time.
- Undo (Ctrl + Z) & Redo (Ctrl + Y)
- Chart Layout (Multiple Charts) – This one allows to plot multiple charts on one screen up to 8 charts for making comparative analysis of the chart easy. There are many way to use this tool for traders and investors.
- Save Chart Layout (Ctrl + S)
- Chart Properties (Mouse Right Click + Setting) –
- Symbol – This controls every setting about Scrip information display.
- Status Line – These are chart description settings
- Scales- Every alteration you can make in this setting of chart
- Appearance – This is all about aesthetics of chart. You can create a customized experience of chart display using this option
- Trading – This one is used while trading on TradingView to Buy/Sell Security
- Events – This informs about the corporate action about the specific scip selected for chart.
- Full-Screen Mode
- Take a Snapshot/Screenshot (Alt + S)
- Publish View for Public and Private – By using this option you can publish your analysis to the public community.
Left Menu (These all are Technical Analysis Tools)
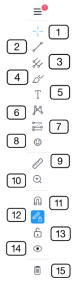
- Cross-Over
- Trend Line Tools
- Gann & Fibonacci Tools
- Geometric Shapes
- Annotation Tools
- Patterns
- Prediction and Measurement Tools
- Icons
- Measure (Shift + Click on chart)
- Zoom In/Out
- Magnate (Crtl + Click on Chart)
- Stay in Drawing Mode
- Lock all Drawings
- Hide all Drawing Tools (Ctrl + Alt + H)
- Remove (Drawing/Indicators)
- Drawing Tools Toolbar (Show/Hide)
Bottom Sub-Menu
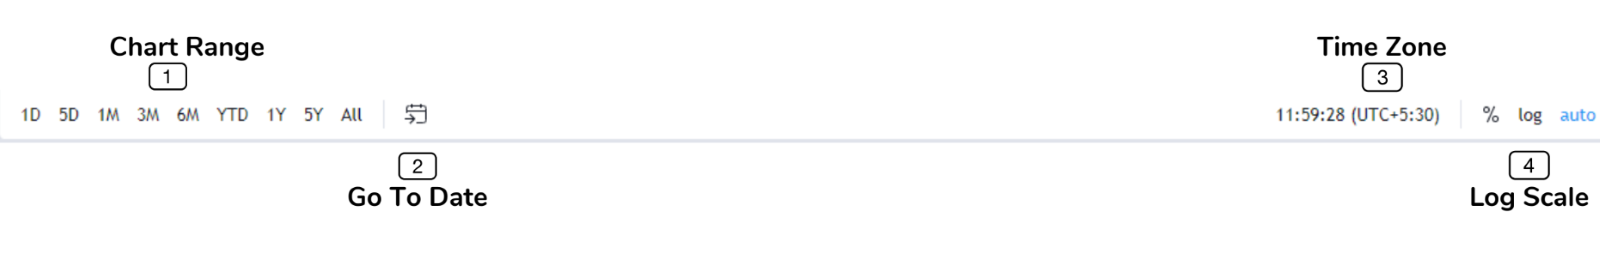
- Chart Range – This is a customized chart frame where you can adjust the perfect view of the chart with respect to time.
- Go-to-Date – This provides the option to reach a specific date and specific candlestick
- Time Zone – This is a worldwide clock where you choose Time Zone according to your comfort as you can trade worldwide market through this platform.
- Log Scale – This replaces the scale from normal to logarithmic scale for analysis.
Bottom Menu
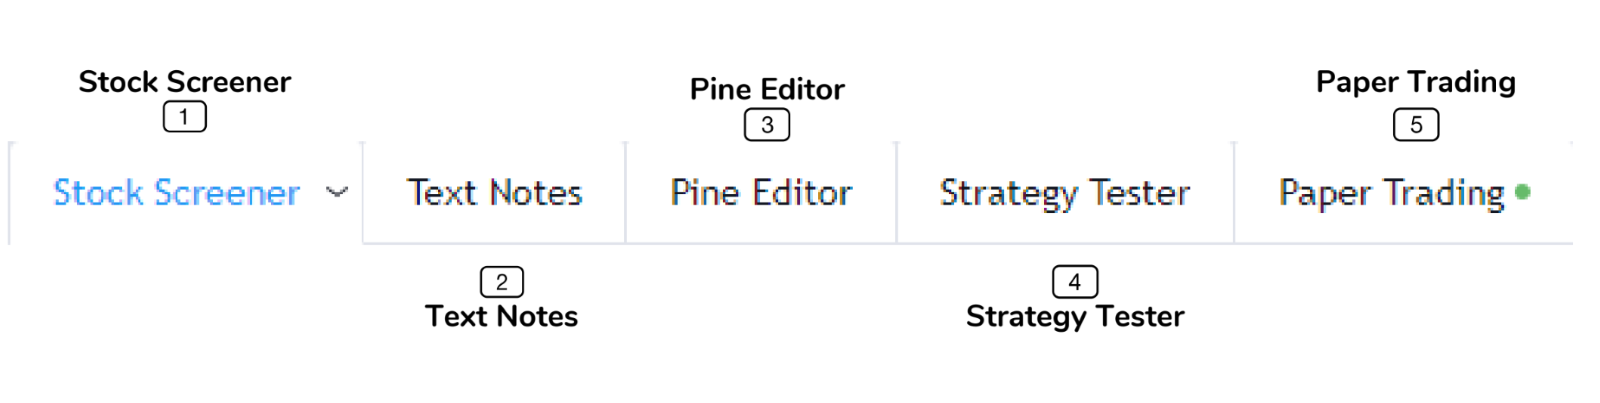
- Stock Screener – This is one of the must tool for traders and investors as this one screens stock on the basis of the requirement of trader by using fundamental attributes as well as technical attributes
- Text Note – This helps to take note of any information for any specific stock or in general.
- Pine Editor – This is the future of Analysis and chart discussed in detail at the end oof this article
- Strategy Tester – After creating a pine script this tool is used as a back tester and generating trade signals.
- Paper Trading – This one is not available for the Indian market till now but this is a virtual trading without indulging actual money into the stock market.
Right Menu
- Watchlist & Detail – TradingView’s watchlist is a powerful tool that allows users to track and monitor their favourite symbols. It is a lesser-known feature that can be used to flag symbols of interest, view fundamental and technical data, and get a quick overview of a symbol’s performance and condition.
- Alerts – The alerts section allows us to track stocks, but it is not available in the free version. We can sort alerts by various options, and the alert log shows us the same details.
- News – The news section is not very useful for Indian markets yet, but it can be used to track large-cap stocks.
- Data Window – Data Window shows us specific detail about day movement according to the chart and this we can see Date, Open. High, Low. Close, Change, and volumes.
- Hotlists – Hotlists are a way to see all of the options that are almost available on normal screeners on the market. You can view options here based on a variety of criteria, including percent change gainers, percent change losers, percent range gainers (open to close %), percent range losers (open to close %), gap gainers, gap losers, percent gap gainers, and percent gap losers.
- Calendar – The calendar option provides you with main events across the world and also added earning calendar for the Indian market.
- My ideas – My Ideas tab provides you, your recent published charts and ideas on the TradingView community.
- Public Chats – Public Chats provide you the option to communicate with the community for a better experience of charting.
- Private Chats – This allows you to have one to one interaction with people across community.
- Ideas Stream – To stream online like Tik Tok or YouTube.
- Notifications – To see comments, new followers, mentions in charts.
- Order Panel – This one is used to put orders of buy/sell while trading.
- Depth of Market – This is an Order Book which shows how much open buy and sell order are there on selected security on different prices.
- Help Centre – Service by TradingView as Support.
- Object Tree – It is used to manage drawings over charts
Here are Two Most Important Tools for this Techno-Savy World
1. Pine Editor/Pine Script
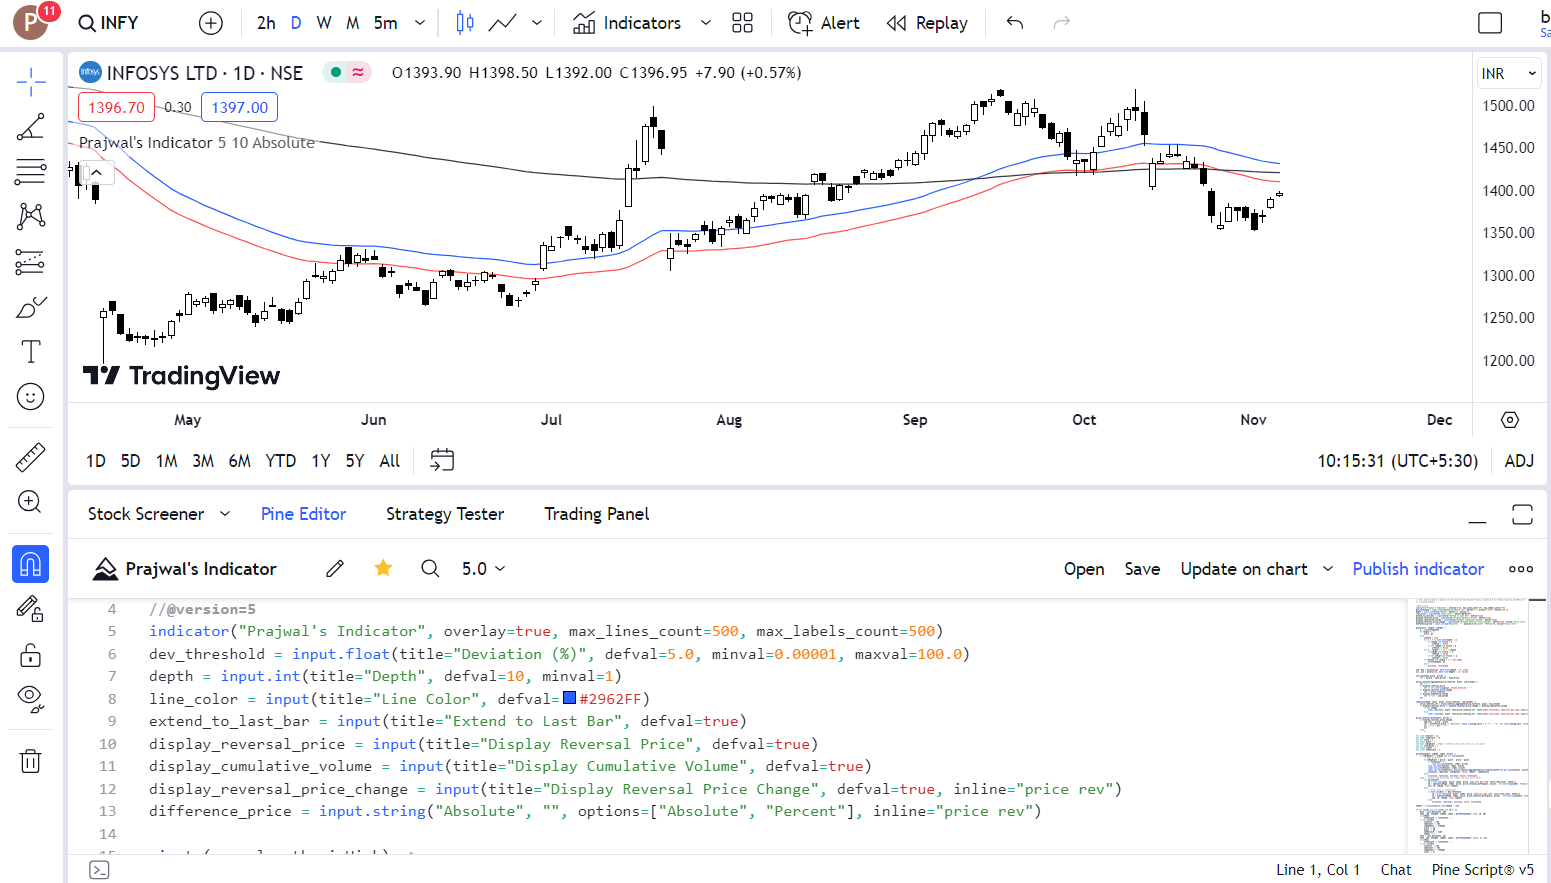
Pine Script is a programming language developed by TradingView specifically for writing custom indicators and strategies. It is a lightweight and easy-to-learn language, making it a great option for traders of all levels of experience. Pine Script code is written in a dedicated editor in the lower panel of the TradingView chart.
The editor is designed to be user-friendly, with auto-highlighting of built-in elements and tooltips that provide additional information. Once you have written your Pine Script code, you can add it to your chart and use it to perform technical analysis or execute trades. Pine Script indicators and strategies can be back-tested and paper traded to ensure that they are profitable before being used in live trading.
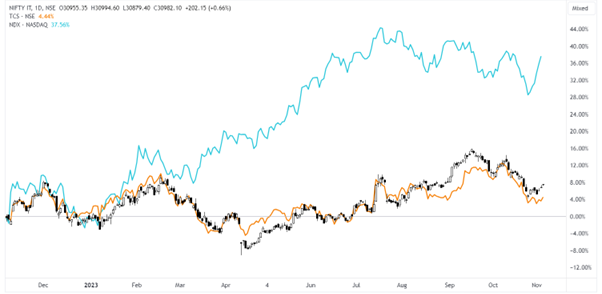
2. Comparing Charts
The compare function tool allows you to compare the market movements of two or more different symbols simultaneously. This can be useful for visualizing market health as a whole or for identifying trading opportunities. For example, the example above shows a chart containing the Nifty IT, TCS, and Nasdaq 100 symbols. This chart allows you to easily see how the Nifty IT, TCS, and Nasdaq 100 are performing relative to each other.
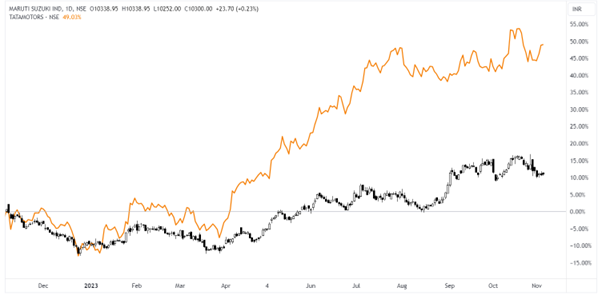
Another use of a comparison chart is to compare two companies in the same sector. This narrows the snapshot down to a single sector instead of the entire market. For example, a comparison chart could compare Maruti and Tata Motors to see how they perform against each other in the automobile sector.
Disclaimer: This blog has been written exclusively for educational purposes. The securities mentioned are only examples and not recommendations. It is based on several secondary sources on the internet and is subject to changes. Please consult an expert before making related decisions.

