


Whenever there is a question regarding what to buy, we compare available options on the basis of features and strength. This is how a comparison of benchmark and desired security is judged by relative strength. Relative strength is used to compare the performance of a stock vs the comparable index or a security. It is a ratio that depicts the picture of stock price performance over a selected benchmark.
Learning about ratios can open up opportunities in spread or pairs trading and offer valuable insights into the stock market. It’s important to note that the relative strength ratio is different from the Relative Strength Index (RSI). RSI focuses on analysing the momentum of a single stock, while the relative strength ratio compares one stock to another.
Read: RSI Trading Strategies
Calculation of Relative Strength
Relative Strength, often called RS, is like comparing two friends’ scores in a game to see who’s doing better. You take one friend’s score and divide it by the other friend’s score. If the result goes up, it means the first friend is doing better. If it goes down, the second friend is winning. If the result doesn’t change much, neither friend has an advantage. So, when the RS line is going up, it means the first thing (like a stock or investment) is doing better than the second thing. If it’s going down, the first thing is doing worse. And if it’s flat, there’s no clear winner between them.
So, the academic derivation of Relative Strength is dividing one security’s price by a second security’s price (the “base” security). The result of this division is the ratio, or relationship, between the two securities. When the RS line is rising, the numerator (top) security is outperforming the denominator (bottom) security.
Relative Strength = (Base security / Comparative security) X 100
Relative Strength can be used to do stock analysis by comparing its price with any index or stock. For example, one can compare TCS performance with Infosys. Let’s say an investor wants to compare the performance of stock TCS with the performance of Infosys over 5 days.
Here are the closing prices for each at the end of each month:
| Date | TCS LTP | INFOSYS |
| 12-10-2023 | 3,542.25 | 1,464.55 |
| 13-10-2023 | 3,570.30 | 1,431.80 |
| 16-10-2023 | 3,524.15 | 1,434.45 |
| 17-10-2023 | 3,560.65 | 1,442.70 |
| 18-10-2023 | 3,622.15 | 1,440.75 |
To calculate the relative strength of ABC compared to the S&P 500, we use the formula:
Relative Strength = Price of TCS / Price of INFOSYS
So, for each day, Alice can calculate the relative strength as follows:
| Date | TCS LTP | INFOSYS | Relative Strength |
| 12-10-2023 | 3,542.25 | 1,464.55 | 2.42 |
| 13-10-2023 | 3,570.30 | 1,431.80 | 2.49 |
| 16-10-2023 | 3,524.15 | 1,434.45 | 2.46 |
| 17-10-2023 | 3,560.65 | 1,442.70 | 2.47 |
| 18-10-2023 | 3,622.15 | 1,440.75 | 2.51 |
We can then plot the relative strength of TCS on a chart over the five days to see its trend, and we can see that the calculated value of TCS compared to Infosys has generally been increasing every day. This indicates that TCS has been outperforming Infosys over time. An investor can use this information to make informed investment decisions, such as buying TCS as a potential investment opportunity.
Real-Time Examples of Relative Strength
- Coal India Vs. Nifty 50
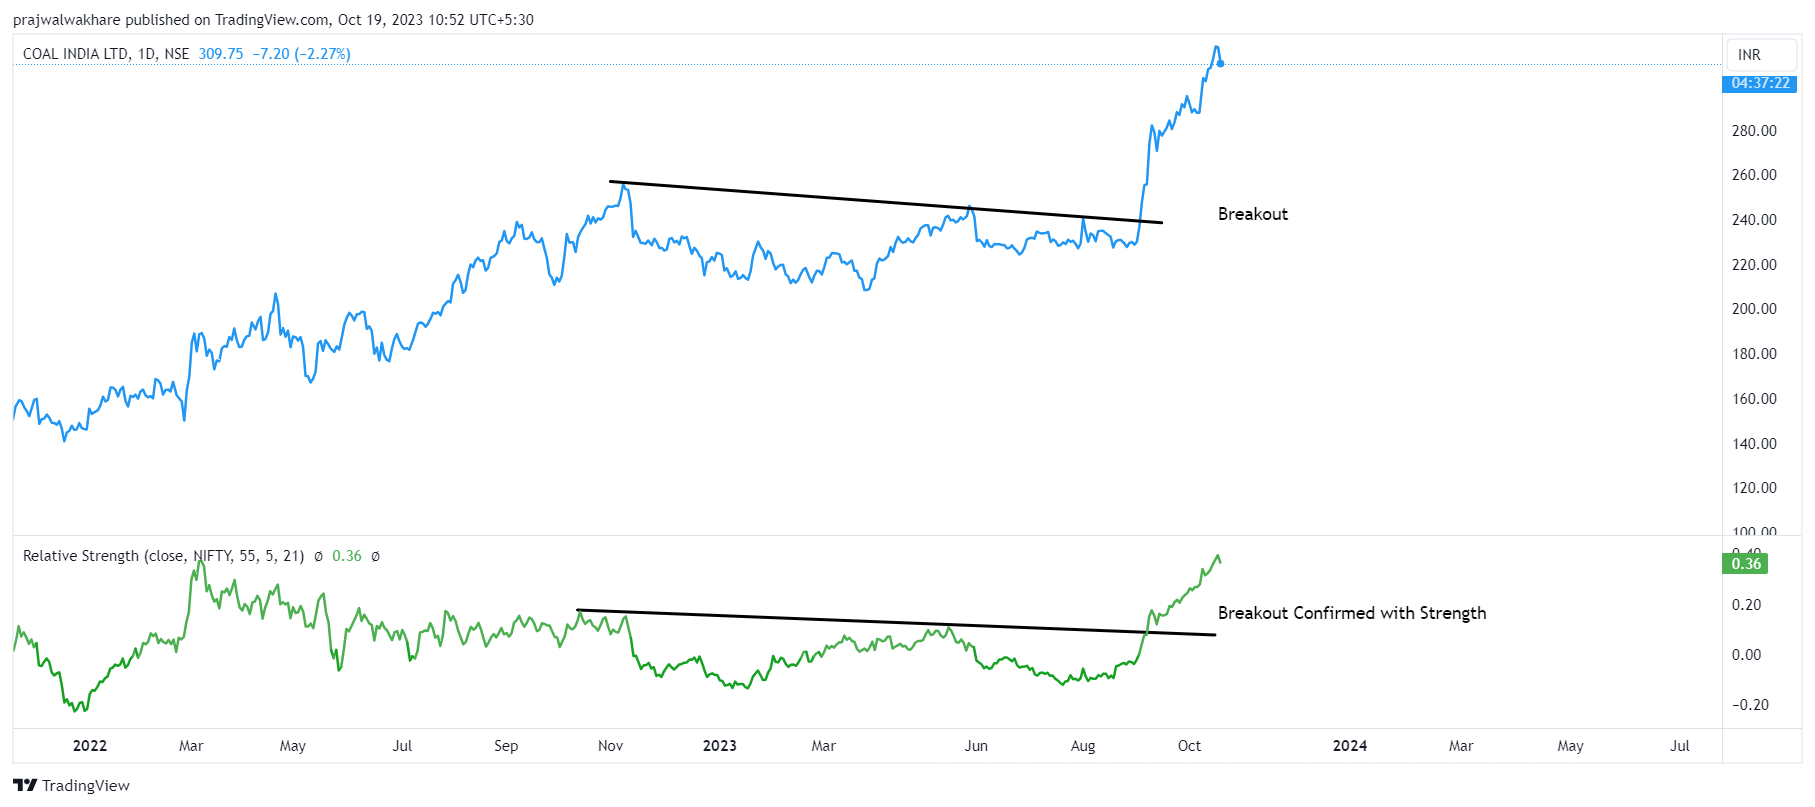
In the above example as the price given breakout through the trendline, the relative strength confirms the strength of the stock price that it can perform much better than NIFTY 50 and such is reflected by the share price on the chart.
- Nestle India Vs. Britania
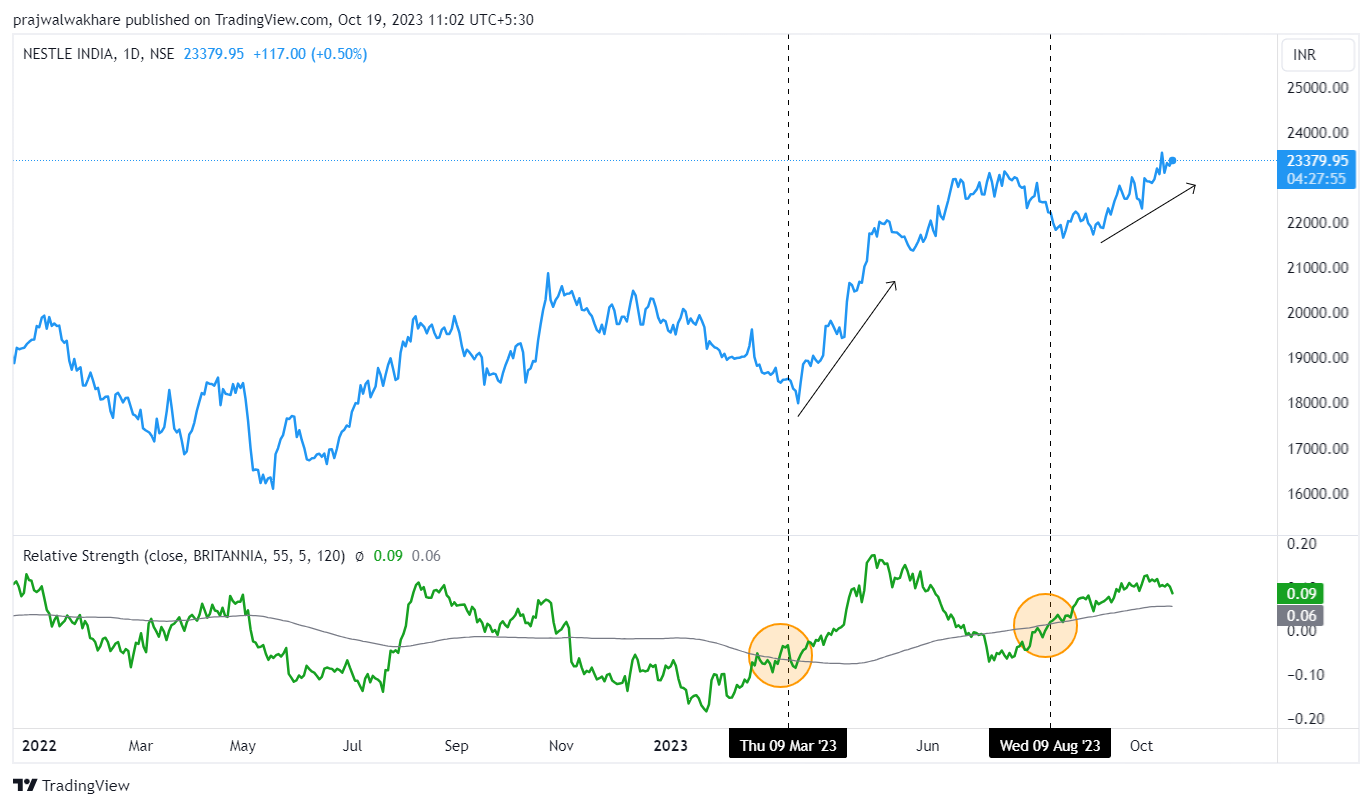
The chart above displays the daily movements of Nestle India (represented by the blue line) and the Relative Strength of Nestle India compared to Britannia (shown as the green line). A 120-day moving average is applied to both the RS lines. On March 9, 2023, and August 9, 2023, the Relative Strength began trading above the 120-day moving average, indicating that Nestle India was outperforming Britannia during those periods. However, after crossing the average in March 2023 and August 2023, both the price chart and RS peaked, forming higher highs and higher lows. This uptrend suggests that Nestle India was consistently outperforming Britannia.
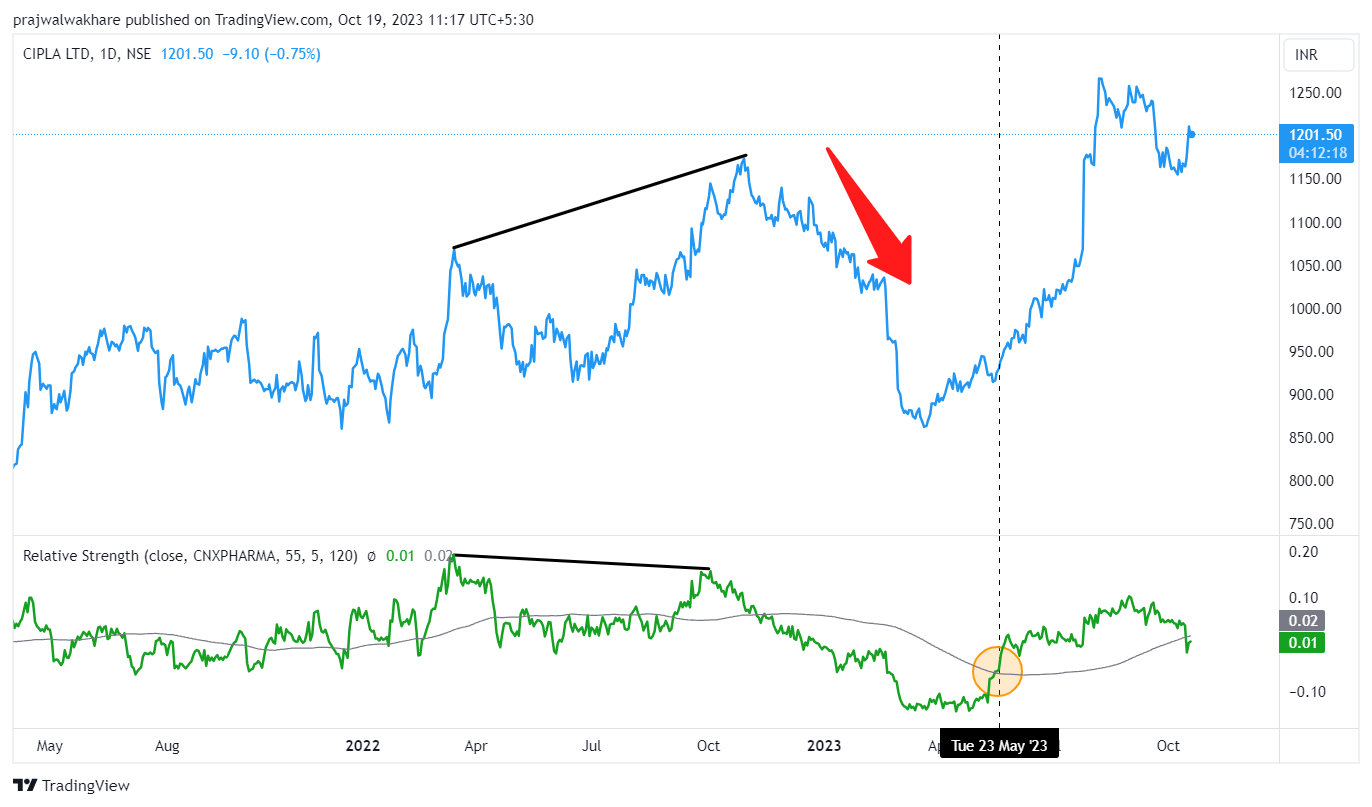
- Cipla vs NIFTY Pharma Index (CNX NIFTY)
Bullish and bearish divergences are fundamental concepts in technical analysis for identifying potential shifts in trends. In the context of Relative Strength (RS) as a technical indicator, a bullish divergence occurs when a stock’s price is decreasing, but the RS is on an upward trajectory. This signifies that, although the price is still declining, the strength behind the downtrend is diminishing, suggesting a possible reversal. Conversely, a bearish divergence emerges when the stock price is rising, but the RS is in a downtrend. This implies that while the price continues to climb, the momentum supporting the uptrend is waning, indicating a potential reversal in the stock’s price chart. These divergence patterns can serve as effective tools for detecting reversal signals in stock price trends when analyzing RS data.
Read in Detail: Fundamental Analysis vs Technical Analysis
A bearish divergence in Relative Strength indicates that the stock price might struggle to maintain its current value and could experience unfavourable price movements. For instance, consider the chart depicting Cipla with the Price Relative to the NIFTY Pharma Index. In this chart, Cipla’s price exhibited a consolidation phase. While the price of Cipla formed a trough in July and subsequently reached a higher high, the price relative chart remained in consolidation, failing to surpass the previous RS peak. This discrepancy signals a bearish divergence because the price relative strength chart doesn’t align with the upward trend seen in the price chart.
The bearish divergence between these two charts serves as an early warning sign that Cipla’s price may be on the verge of a reversal. Notably, Cipla reached its peak in October 2023 and has since entered a declining trend, consistent with the observations from the price relative chart. Additionally, on May 23, a significant breakout occurred, surpassing the 120-day moving average, suggesting a favourable buying opportunity as the stock’s price was at its base, indicating a high potential for outperforming the NIFTY Pharma index.
- PSU Banks Vs. PVT Banks
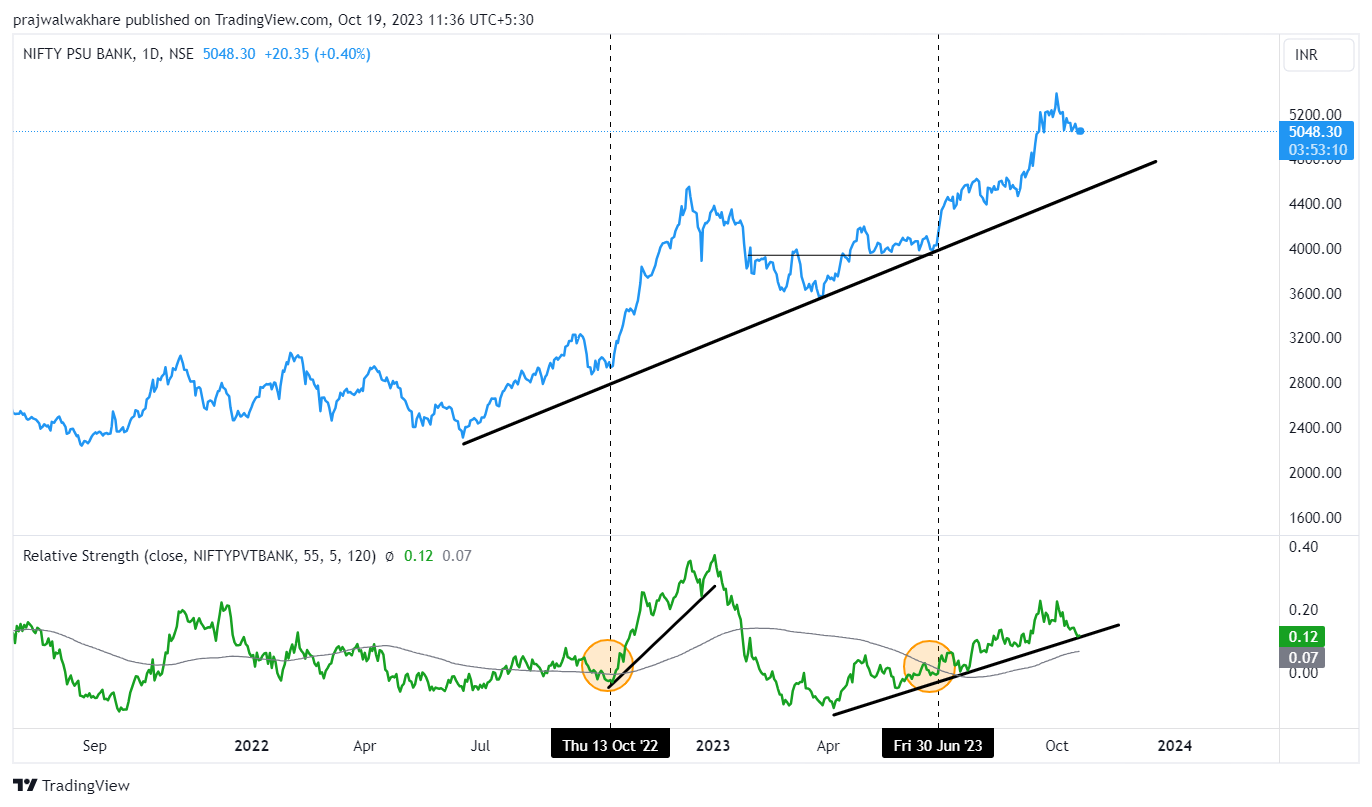
The chart illustrates a comparison of banking indices within the framework of Relative Strength, specifically NIFTY PSU banks against the NIFTY PVT Bank index. As depicted in the chart, the price of the PSU Bank index exhibits an uptrend, but following the formation of the first higher high supported by a rally on October 13, 2022, Relative Strength declined. This decline indicates the underperformance of PSU Banks during that period, with Private banks outperforming PSU banks. Subsequently, on June 30, 2023, the PSU Bank index initiated a rally, and this is mirrored in the Relative Strength chart, signifying the outperformance of the PSU Bank Index during that time.
Disclaimer: This blog has been written exclusively for educational purposes. The securities mentioned are only examples and not recommendations. It is based on several secondary sources on the internet and is subject to changes. Please consult an expert before making related decisions.

