


Swing highs and swing lows are fundamental elements in many trading strategies, guiding decisions on stop-loss placement and shaping trading signals. Despite their significance, there’s often a lack of precise definitions and systematic methods for pinpointing these critical points on a chart. As a result, traders often rely on rough approximations, leaving room for subjectivity.
In this guide, we aim to eliminate this ambiguity. We’ll provide you with a clear, objective approach to identifying swing highs and swing lows, empowering you to implement this knowledge in your trading strategy for a more structured and effective approach. The best part? It only takes about 5 minutes to grasp the essentials.
Understanding Swing Highs and Swing Lows
Before diving into the identification process, let’s establish a quick definition. Think of swing highs and swing lows as standout price points within a broader price movement. These are the highest and lowest points in a price trend that encompasses multiple candles.
On the chart below, we’ve encircled some price points that serve as clear examples of swing highs and swing lows. With this foundational understanding, let’s move forward to demystify the process.
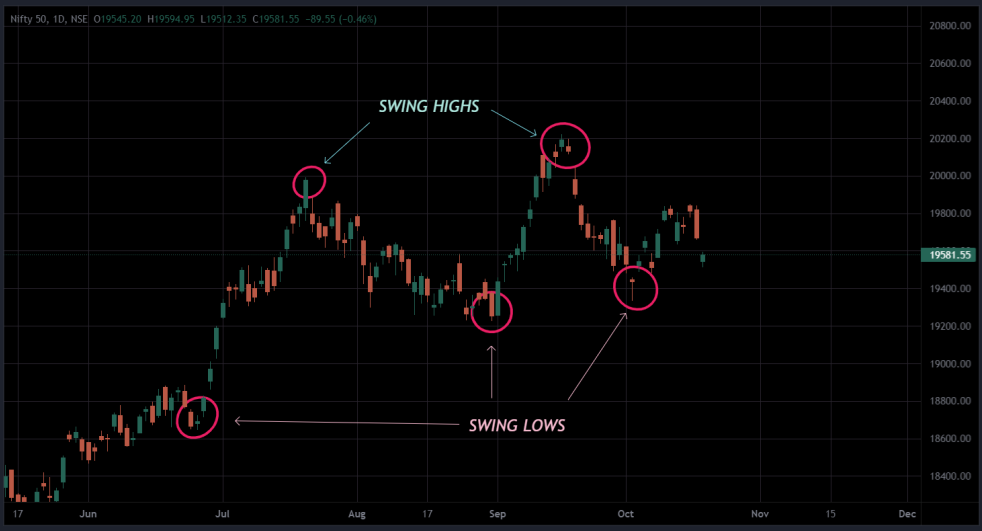 NIFTY 50, 1D
Precision in Price Analysis: The Method for Identifying Swing Highs and Lows
In the world of Swing trading, it’s not uncommon to select crucial levels somewhat instinctively. These are the highs and lows that seem right, but there’s often a lack of a defined rule to pinpoint precisely which points to consider. This lack of objectivity can become a roadblock when trying to codify a strategy or communicate it to others.
Even if you have no intention of formalizing your strategy or sharing it, an objective method for identifying these critical prices can significantly enhance your trading consistency. So, let’s dive into how to accurately recognize swing highs and swing lows.
Identifying Swing Highs and Lows: A Systematic Approach
To identify swing highs and swing lows with precision, start by selecting a specific candle and scrutinize the candles both to its left and right. A high qualifies as a swing high when it exhibits a lower high on the right side and a lower high on the left side as well.
This method brings clarity and objectivity to the process, ensuring you make consistent and well-informed trading decisions.
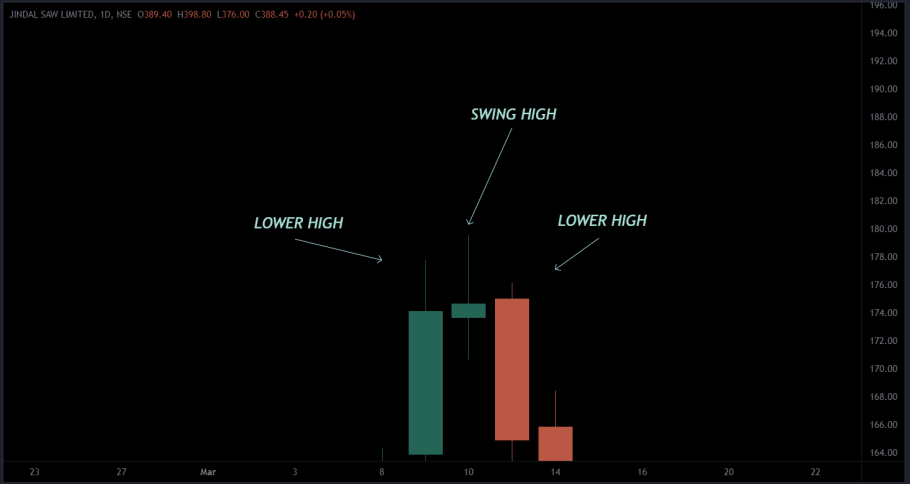
JINDALSAW, 1D
On the flip side, when it comes to identifying swing lows, the rule is straightforward: a low is considered a swing low if it displays a higher low on its right and a higher low on its left. This clear and systematic approach ensures you can confidently distinguish between swing highs and swing lows, providing a solid foundation for your trading strategy.
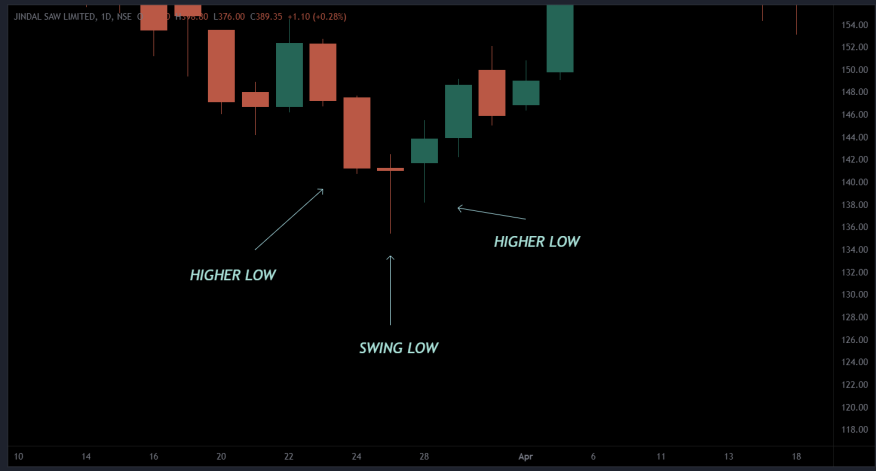
JINDALSAW, 1D
Now, to summarize the rules:
Swing High:
- Right side: Lower High
- Left side: Lower High
Swing Low:
- Right side: Higher Low
- Left side: Higher Low
With these foundational rules in place, you’ve learned how to identify swing highs and swing lows. However, these rules alone may result in a plethora of swing prices. To refine this and distinguish swing points based on their significance, we’ll introduce additional criteria in the following sections.
Refining Your Selection: Identifying Significant Swing Highs and Lows
Now that you can identify swing highs and swing lows, the next challenge is to determine which of these price points hold the most importance in your analysis.
One effective method is to assess the “isolation” of a specific price point. In this context, the best swing prices are those that possess ample space to the left.
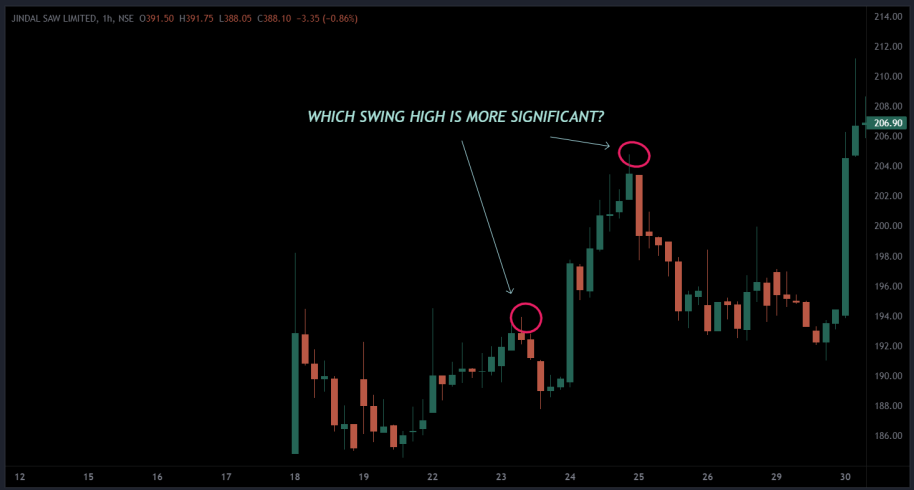
JINDALSAW, 1H
Now that you’re familiar with identifying swing highs and swing lows, the question arises: how do you determine which of these price points carry more weight in your analysis?
Consider this: both highs may meet the criteria for being a swing high, yet the second one often appears notably more significant. It’s almost instinctual to skip the first candle and opt for the second.
The rationale behind this inclination lies in the fact that the first swing high is somewhat concealed amidst numerous other candlesticks, while the second swing high enjoys greater space to its left, making it more conspicuous.
This observation underscores a critical insight: the less crowded the price action to the left of a swing high or low, the more significance it typically holds.
You can leverage this insight to refine your analysis by, for example, establishing a rule that only considers swing prices associated with at least a specific number of prior candle highs or lows (e.g., 4 candles). This not only aids in determining the most meaningful swing prices but also assists in drawing trendlines by connecting the right points.
In conclusion, now equipped with the skill to recognize and refine swing highs and lows, you’re better positioned for successful trading.

