


The cradle candlestick pattern is a rare but powerful bullish reversal pattern that occurs in a downtrend. It is formed by three or more doji candlesticks that are all of similar size, with small bodies and long shadows. The shadows of the doji candlesticks should overlap, creating a cradle-like shape.
The cradle candlestick pattern indicates that selling pressure is exhausted and that buyers are starting to take control. It is often followed by a breakout to the upside, as buyers push prices higher.
There are a few different ways to trade the cradle candlestick pattern. One way is to wait for the pattern to complete and then enter a buy order above the high of the last doji candlestick. Another way is to enter a buy order on a break of the cradle pattern.
The cradle candlestick pattern is a high-probability reversal pattern, but it is important to remember that it is not a guarantee of a successful trade. Always use risk management techniques when trading any candlestick pattern.
Steps To Spot the Cradle Candlestick Pattern on a Chart
- Trend Precedence: Start by identifying a clear downtrend. This pattern typically emerges after a series of declining candles.
- First Candle:The first candle in the pattern should be a red candle, indicating a continuation of the downtrend.
- Second Candle:Look for a green candle that follows the red candle. This green candle signals the potential reversal.
- Candle Size:The green candle should be larger than the preceding red candle but not excessively large. It indicates that buyers are stepping in with greater force than the sellers of the previous day.
- Range Containment:Both the red and green candles should fit within the range of one or more of the preceding candles, forming a ‘cradle’. This means the high of the green candle shouldn’t exceed the high of the previous candle(s), and the low shouldn’t fall below the low of the previous candle(s).
- Volume Consideration: A spike in trading volume on the day of the green candle can further validate the pattern’s strength and the likelihood of a trend reversal.
- Confirmation:While the cradle pattern alone can suggest a reversal, many traders wait for further confirmation, like another bullish candle or technical indicator, before making a trading decision.
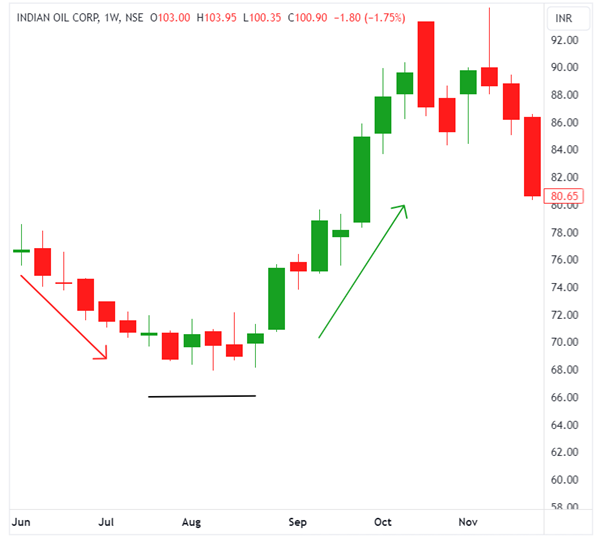
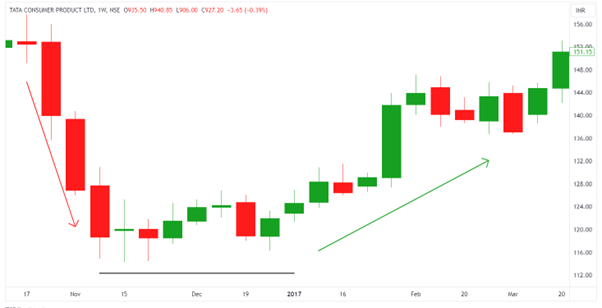
Following are the two stocks chart in which cradle candlestick pattern appeared on weekly timeframe:
Indian Oil Corporation Ltd
Tata Consumer Product Ltd
Significance of Cradle Candlestick Pattern
- The Cradle Candlestick Pattern is a continuation pattern that signals a potential change in market direction.
- It indicates that the selling momentum is waning and a bullish sentiment may be on the horizon.
- The pattern’s structure gives traders a tangible point of reference for risk management.
- When paired with other technical analysis tools, the cradle pattern can increase its predictive power.
Read: Master Candlestick Patterns: A Guide to Enhance Your Trading Strategies
What is happening within the Cradle Candlestick Pattern?
Big traders may distribute or accumulate shares during a downtrend before the cradle pattern forms.
The initial red candle of the cradle pattern could represent the tail end of the distribution, while the green candle may signify the beginning of accumulation by big traders.
Increased volume during the green candle formation may indicate active participation by institutional traders.
Big traders may use stop hunts to trigger stop-loss orders of retail traders, allowing them to buy shares at a better price.
The cradle pattern often forms around key price levels, such as support and resistance or Fibonacci retracement levels.
Confirmation Tools for Cradle Candlestick Pattern
- Support/Resistance: The appearance of a cradle pattern near historical support or resistance levels enhances its validity. This suggests that the level is respected and could act as a strong base for a potential reversal.
- High Volume: An increase in volume, especially during the formation of the green candle, suggests active participation by larger players. High volume lends credibility to the pattern, indicating a stronger commitment from buyers.
- Technical Indicators: Bullish divergences on oscillators like RSI or MACD, when aligned with the cradle pattern, provide a stronger case for a potential reversal. For instance, if the price makes a lower low but the RSI makes a higher low, it indicates a weakening downward momentum.
Know: RSI Trading Strategies
Disclaimer: This blog has been written exclusively for educational purposes. The securities mentioned are only examples and not recommendations. It is based on several secondary sources on the internet and is subject to changes. Please consult an expert before making related decisions.

