


In the world of trading, the Fibonacci retracement tool stands out as an ancient and unique instrument. Unlike lagging indicators such as moving averages, Fibonacci retracement levels lead price movements, offering a glimpse into potential market developments before they occur. Remarkably, this tool is readily available on virtually every charting platform, making it indispensable for traders, particularly when navigating trending markets.
This article will delve into the essence of Fibonacci retracement levels, elucidating their significance, how to incorporate them into trading, and the common pitfalls traders should avoid. Before delving into these practical aspects, let’s first explore the origin of Fibonacci levels and the relevance of the golden ratio in the financial markets.
The Fibonacci Sequence
The Fibonacci retracement levels originate from the Fibonacci sequence, a numerical series devised by the Italian mathematician Leonardo of Pisa, widely known as Fibonacci. This sequence commences with 0 and 1, with each subsequent number being the sum of the two preceding numbers. The sequence progresses indefinitely: 0, 1, 1, 2, 3, 5, 8, 13, 21, 34, 55, 89, 144, 233, 377, 610, 987, 1597, and so forth.
A notable observation about these numbers is that, starting from 21 onward, each number approximates 161.8% of the number immediately preceding it. In other words, each number constitutes 61.8% of the number that follows it. For instance, when dividing 34 by 55, the result is 0.618, signifying that 34 is 61.8% of 55. Conversely, dividing 55 by 34 yields 1.618, famously referred to as the golden ratio due to its pervasive occurrence in various natural phenomena.
The discoveries of Leonardo Fibonacci can be traced back to his travels with his father in the Mediterranean during his youth. Born in 1170 in Pisa, Italy, he gained exposure to the Hindu-Arabic numeral system during these voyages. Upon his return to Italy in 1202, Fibonacci compiled his findings into the renowned mathematical compendium “Liber Abaci.” This work played a pivotal role in introducing the Hindu-Arabic numeral system to Europe and the broader Western world.
The Golden Ratio and Other Fibonacci Ratios
The golden ratio, 1.618 or its inverse 0.618, plays a crucial role in the world of trading. The 0.618 ratio gives rise to the 61.8% Fibonacci retracement level, while the 1.618 ratio generates the 161.8% extension or expansion level. In addition to the golden ratio and its inverse, other ratios can be derived from the Fibonacci sequence.
For example, dividing a number in the sequence by the number two places to the right, such as 89 divided by 233, results in 0.382 (38.2%), one of the Fibonacci retracement levels. The inverse of 0.382 is 2.618 or 261.8%, another expansion or extension level. Similarly, dividing a number in the sequence by a number three places later, for instance, 34 divided by 144, yields the ratio 0.236 (23.6%), another key Fibonacci retracement level.
While some argue that the 50% and 100% levels are not technically Fibonacci ratios, they are integral to the sequence, as dividing 1 by 2 gives 50%, and dividing 1 by 1 results in 100%. In trading, the significant Fibonacci ratios include 0.236, 0.382, 0.618, 1.618, and 2.618.
Fibonacci Retracement Levels in Trading
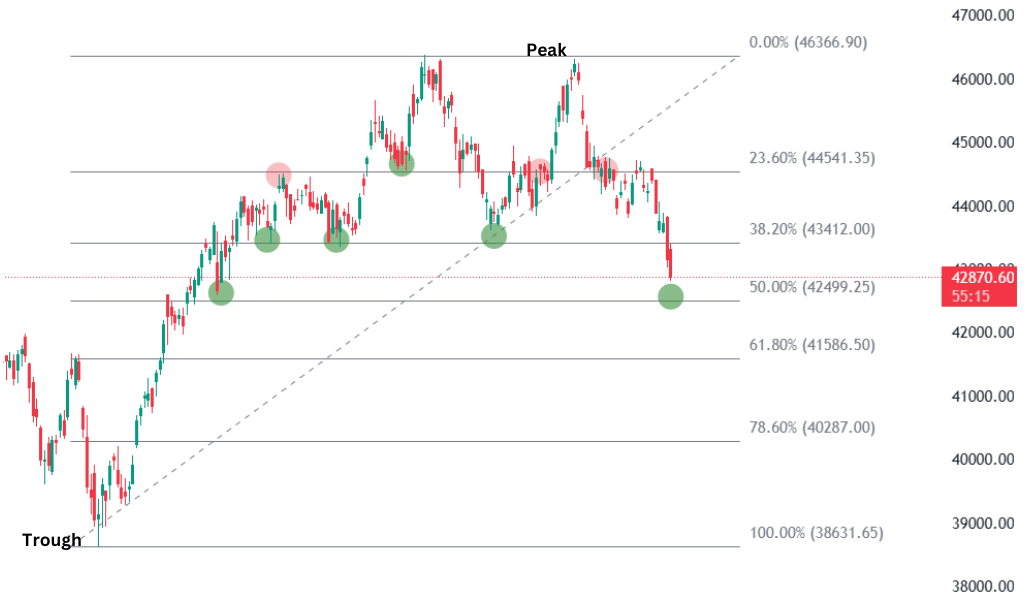
In trading, Fibonacci retracement levels play a pivotal role in identifying potential support and resistance areas. These levels represent specific percentages of a preceding impulse wave and indicate the extent to which a pullback may retrace before initiating a reversal in the trending direction. Consequently, they signify areas of potential support or resistance. Notably, the Fibonacci retracement tool highlights these levels even before the price reaches them, creating a predictive aspect. The most commonly utilized retracement levels include 23.6%, 38.2%, 50%, 61.8%, and 78.6%.
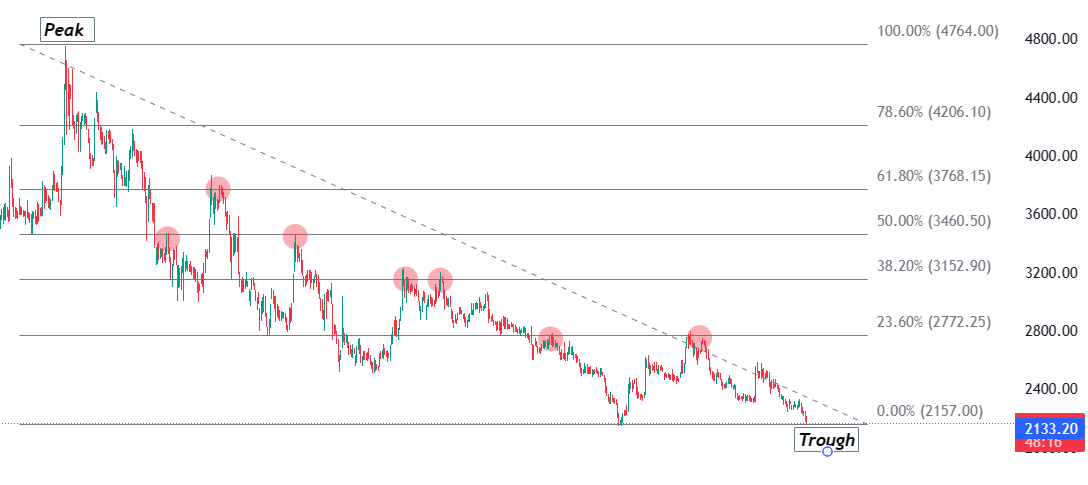
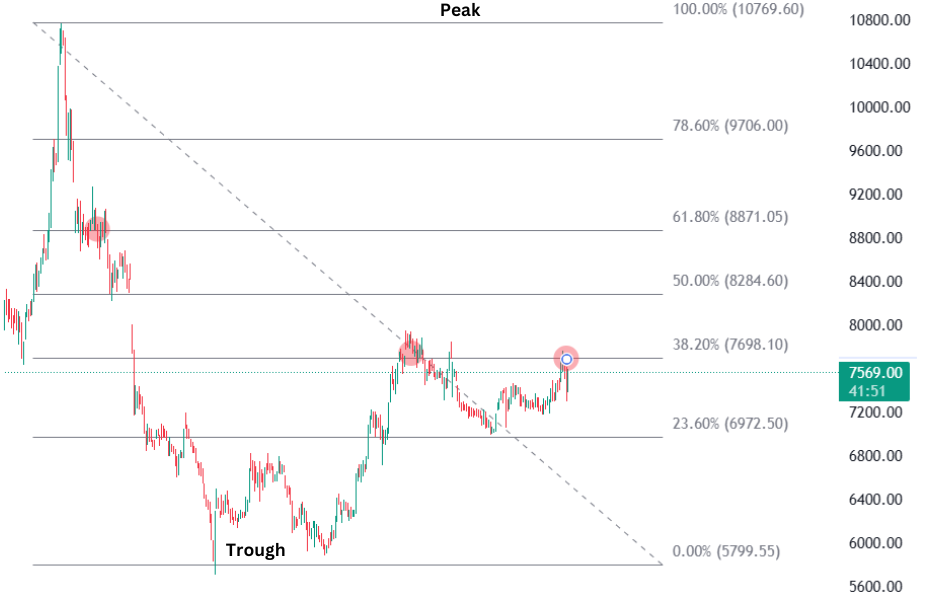
Here is a step-by-step guide to constructing Fibonacci retracement:
- Identify the immediate peak and trough as shown in the charts below.
- Select the Fibonacci retracement tool from the chart tools.
- Use the Fibonacci retracement tool to connect the trough and the peak.
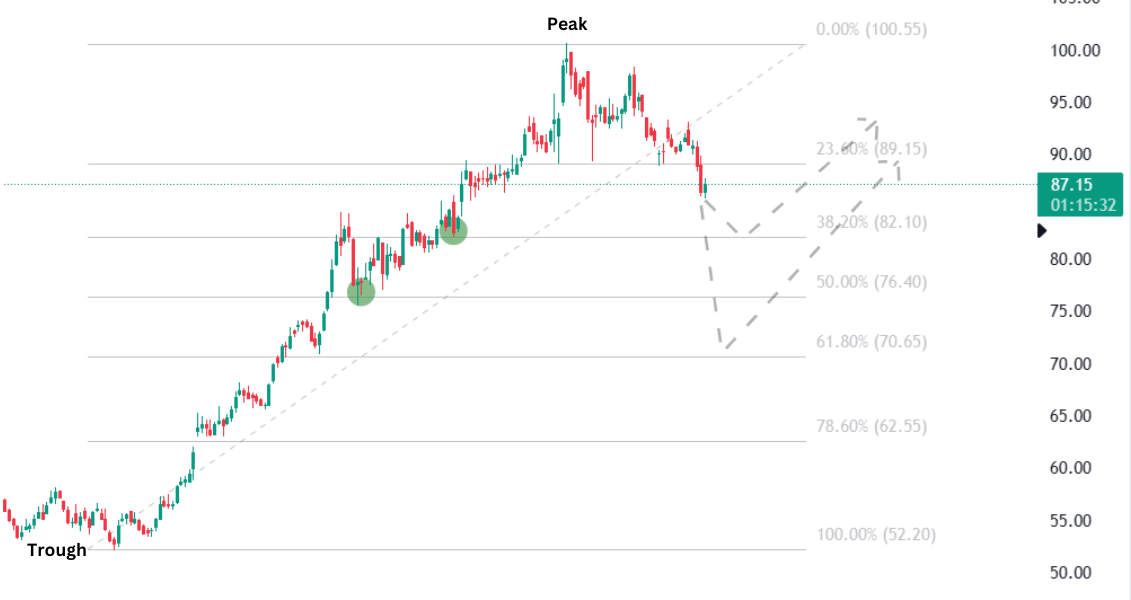
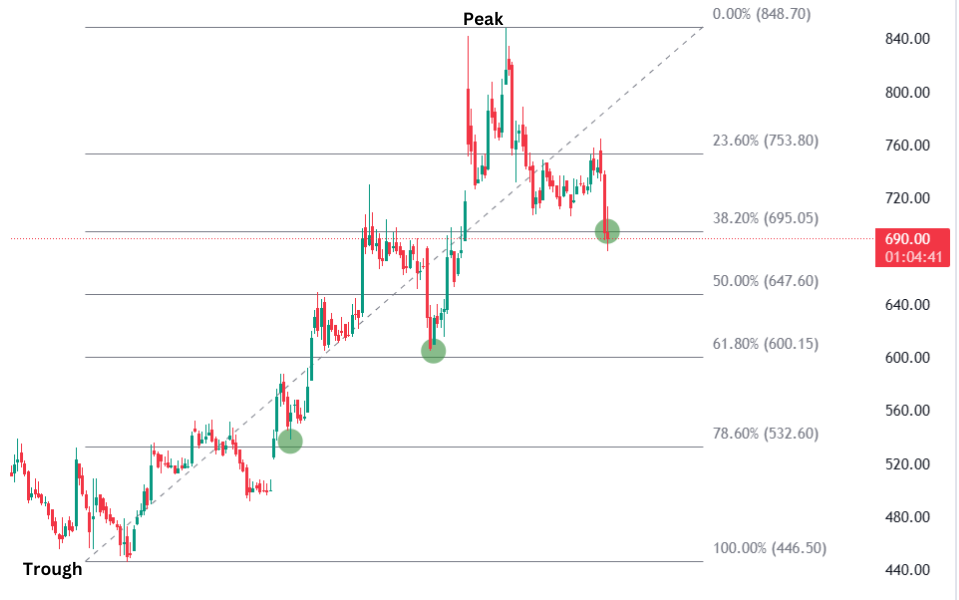
In an Uptrend
When the market is in an uptrend, pullbacks move in a downward direction, and the retracement levels act as potential support levels. Traders monitor these levels for signals that indicate a bullish reversal, such as bullish candlestick patterns or technical indicator signals. By entering a trade at these levels and placing stop loss orders just below higher retracement levels or at the 100% level (representing the previous swing low), traders can aim for upward momentum.
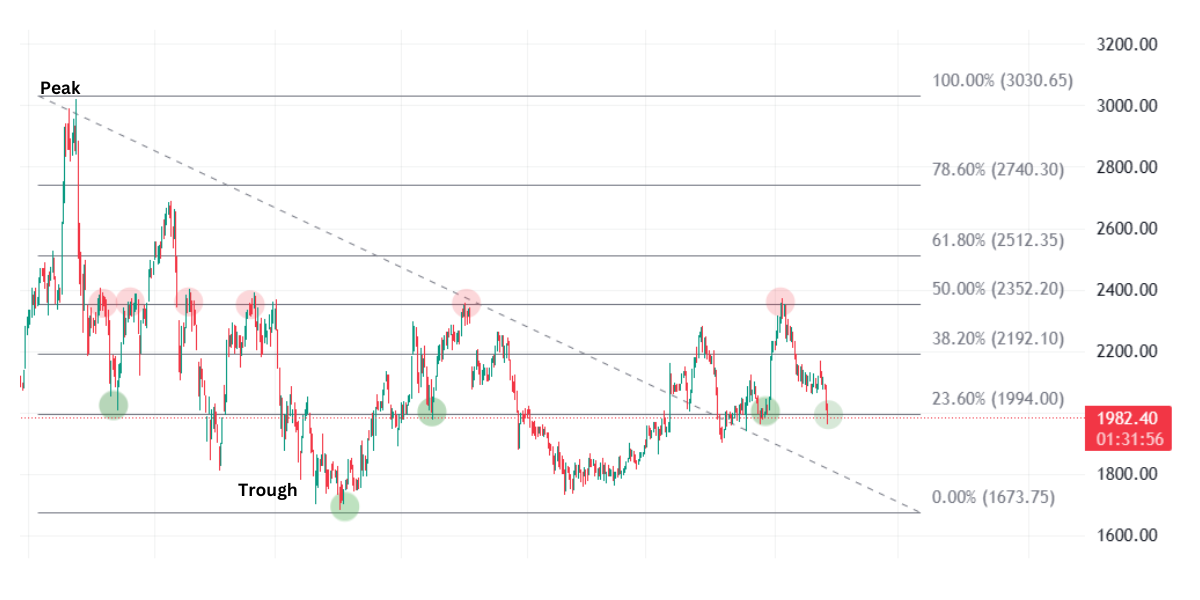
In a Downtrend
Conversely, in a downtrend, pullbacks move upward, and the retracement levels function as potential resistance levels. Traders watch for bearish reversal trade setups when the price approaches these levels, which may manifest as price action patterns or indicator signals. To capitalize on this, traders can enter short positions and place stop loss orders just above higher retracement levels or at the 100% level, representing the previous swing high.
Utilizing Fibonacci Retracement Levels Strategically
By employing Fibonacci retracement levels, a trader can pinpoint these retracement zones, allowing them to position themselves strategically for potential trade entries. However, it’s essential to recognize that Fibonacci retracement should be viewed as a confirmation tool, not a standalone indicator.
The decision to buy or sell an asset should hinge on multiple factors beyond Fibonacci retracement levels. To enhance confidence in a trade, a trader may seek additional confirmatory signals:
- The presence of a recognizable candlestick pattern.
Read: Master Candlestick Patterns
- Alignment of the stop-loss level with significant support and resistance (S&R) levels.
- Above-average trading volumes to validate the price movement.
Moreover, if the stop-loss level aligns with a Fibonacci retracement level, it further reinforces the trade setup’s alignment with various variables. The term ‘strong’ buy denotes a high level of conviction in the trade setup. Utilizing multiple confirming factors to assess market trends and reversals enhances the robustness of the trading signal. This same approach can be applied when considering short trades as well.
In conclusion, Fibonacci retracement levels are a powerful tool in trading, providing traders with predictive insights into potential market reversals. Derived from the ancient Fibonacci sequence and the golden ratio, these levels offer a roadmap for identifying support and resistance areas in both up trending and down trending markets. By following a systematic approach to their construction, traders can strategically position themselves to capitalize on price movements and manage risk effectively.
Read: Systematic Trading: Mastering Risk Management and Drawdowns
Disclaimer: This blog has been written exclusively for educational purposes. The securities mentioned are only examples and not recommendations. It is based on several secondary sources on the internet and is subject to changes. Please consult an expert before

