


")
The Hull Moving Average (HMA) is a technical analysis indicator designed to minimize lag and noise while maintaining smoothness in price data. Developed by Alan Hull in 2005, it aims to address the limitations of traditional moving averages like the Simple Moving Average (SMA) and the Exponential Moving Average (EMA).
What is Hull Moving Average?
It is a moving average variant that lowers lag and allows more precise trend detection. The HMA is computed using a weighted moving average, which emphasizes current price data while smoothing out short-term swings. The HMA is more sensitive to changes in price trends than other moving averages, providing traders with early alerts to buy or sell. This can lower trade expenses while increasing profits. Using the HMA has various advantages, including limiting the influence of false signals and shortening the lag time in spotting price movements. For traders spotting patterns and prospective trading opportunities, the HMA is a valuable technical analysis tool.
How to Calculate HMA?
- Calculate a Weighted Moving Average with period “n/2” and multiply it by 2
- Calculate a Weighted Moving Average for period “n” and subtract it from the one calculated during Step 1
- Calculate a Weighted Moving Average with a period the square root of “n” using the data from Step 2
The formula for the HMA:
HMA = WMA(2*WMA(n/2) − WMA(n)),sqrt(n))
The charting software or broker platform will provide the indicator, so no need to calculate the HMA values.
Trading with HMA
Trend Following
- Use a longer-period HMA to identify the overall trend direction.
- Buy when the price crosses above the HMA and sell when it crosses below.
- Combine with other trend confirmation indicators like moving average convergences/divergences (MACD) or RSI
Read: RSI Trading Strategies
State Bank of India
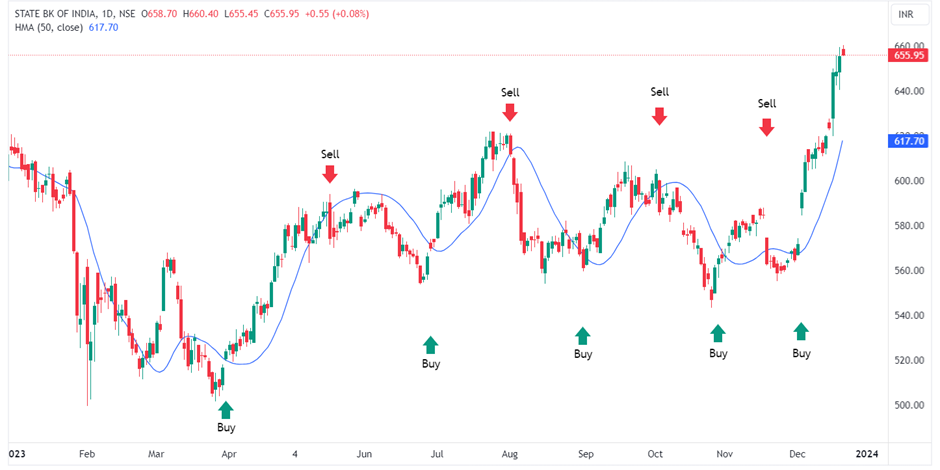
The above daily chart of the State Bank of India shows the entry and exit points using HMA. We can see that the price crossing HMA generates a buy and sell signal to trade the stock. Looking at the returns after trading in this particular stock awards around an average of 6% to 7% gains in a trade. This is not a full backtesting but a small assurance of the HMA tool to trade in the markets.
Crossovers
- Use a shorter-period HMA and longer-period EMA to generate a buy/sell signal
- Buy when the shorter-period HMA rises above the longer-period HMA and vice-versa.
- Use stop-loss orders to limit potential losses in case the trend continues.
Adani Power Ltd
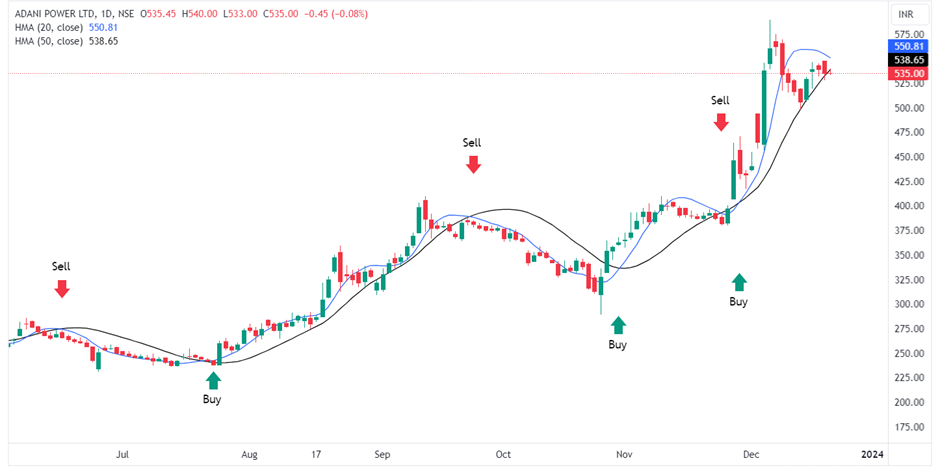
In the above chart of Adani Power, the HMA crossover is used to trade the stock. For the longer-period 50 period, HMA is used whereas for shorter-period 20 period HMA is used. As the HMA crossover happens the trade begins. As the HMA is smoothed and aligns with the trend it may generate many signals while in a consolidation or range offering few losses but those can be covered in one single trade as the stock price starts trending in either direction.
Things to remember
The HMA is just one tool, and it should not be used in isolation for trading decisions. Back-testing your strategies on historical data can provide valuable insights into their effectiveness. Risk management is crucial, and always use stop-loss orders to limit potential losses.
Read: Systematic Trading: Mastering Risk Management and Drawdowns
Disclaimer: This blog has been written exclusively for educational purposes. The securities mentioned are only examples and not recommendations. The information is based on various secondary sources on the internet and is subject to change. Please consult with a financial expert before making investment decisions.

