


Moving Average Convergence/Divergence (MACD) is an indicator used in technical analysis for trading trends. It is an oscillator-type indicator that does not inform about overbought and oversold conditions but instead signals trade entry and confirms the analysis. The MACD is constructed from two moving averages, turning them into a momentum oscillator by subtracting the longer moving average from the shorter one. As a result, the MACD provides information about both trend following and momentum. Traders utilize signal line crossovers, centerline crossovers, and divergences as techniques for generating trading signals.
Calculation for MACD:
- MACD Line: (12-day EMA – 26-day EMA)
- Signal Line: 9-day EMA of MACD Line
- MACD Histogram: MACD Line – Signal Line
The MACD indicator is a popular tool used in trading. It calculates the difference between a 12-day Exponential Moving Average (EMA) and a 26-day EMA of closing prices. A 9-day EMA of the MACD line acts as a signal line to identify potential reversals. The MACD Histogram displays the gap between the MACD line and its 9-day EMA, with a positive histogram indicating that the MACD line is above the signal line and a negative histogram indicating the opposite. While the standard settings are 12, 26, and 9, traders may adjust these values based on their specific trading preferences and objectives.
Read: What is Exponential Moving Average (EMA)
Interpretation of MACD:
One of its primary signals is the Signal Line Crossover, which occurs when the short-term Exponential Moving Average crosses above the long-term EMA, indicating a bullish signal, or when the short-term EMA crosses below the long-term EMA, signalling a bearish trend. Another important signal is the Zero Line Crossover, where the MACD line crosses the zero level. A positive crossover suggests a bullish trend, while a negative crossover indicates a bearish trend, with the distance from the zero line reflecting the trend’s strength. These crossovers help traders identify potential price movements and are often used in conjunction with other technical analysis tools to make informed trading decisions.
The MACD is an oscillator that fluctuates above and below the zero line, known as the centerline. When it crosses the centerline, it signals whether the 12-day Exponential Moving Average is above or below the 26-day EMA. A positive MACD indicates that the 12-day EMA is above the 26-day EMA, with higher positive values indicating increasing upside momentum. Conversely, a negative MACD indicates the 12-day EMA is below the 26-day EMA, and more negative values indicate increasing downside momentum.
Signal Line Crossovers:
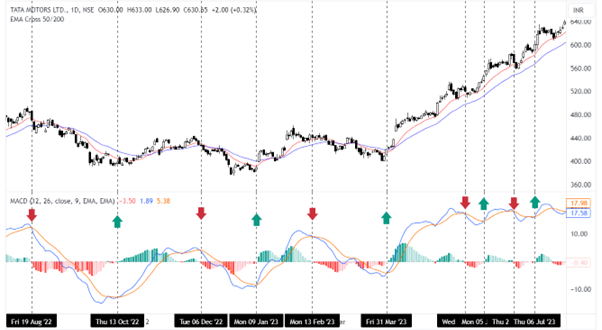
Signal line crossovers are common in MACD analysis, where the signal line, a 9-day EMA of MACD, helps identify potential trend changes. A bullish crossover happens when MACD rises above the signal line, while a bearish crossover occurs when MACD falls below it. However, caution is needed when crossovers occur at extremes or during high volatility, as they may not always indicate reliable signals. Traders should assess the broader context and the underlying security’s momentum.
Tata Motors Signal line crossovers
Centerline Crossovers:
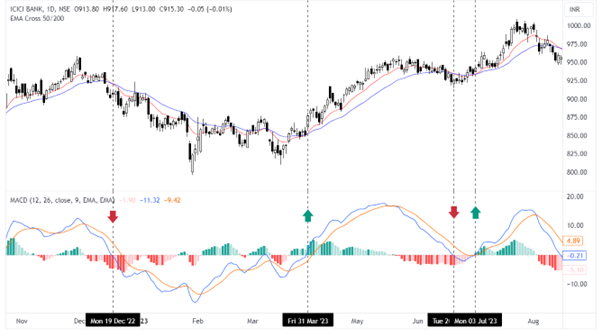
Centerline crossovers are common MACD signals. A bullish crossover occurs when the MACD line goes above zero, indicating a positive trend as the 12-day EMA surpasses the 26-day EMA. Conversely, a bearish crossover happens when the MACD goes below zero, indicating a negative trend as the 12-day EMA falls below the 26-day EMA. The duration of these crossovers varies, lasting from a few days to months, depending on the trend’s strength. When in an uptrend, the MACD stays positive, and in a downtrend, it remains negative, making these crossovers useful for identifying strong trends.
ICICI Bank Centerline Crossovers:
Divergences:
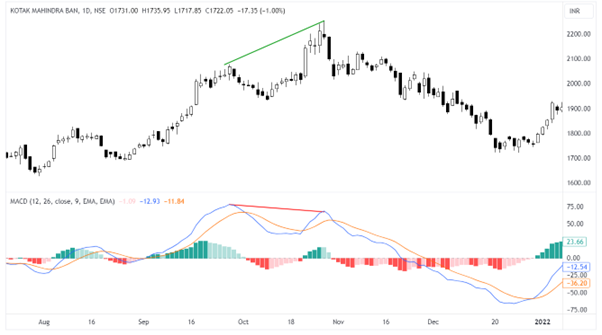
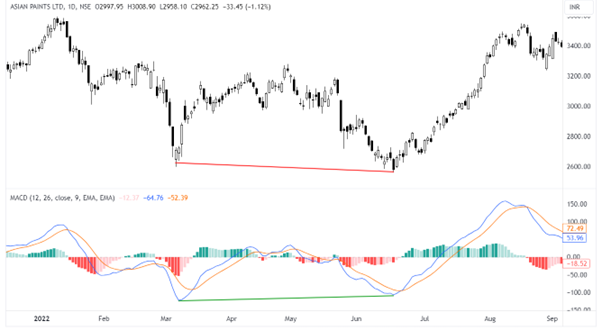
Divergences in technical analysis can provide valuable signals for potential trend reversals. A bullish divergence occurs when security makes a lower low while the MACD indicator forms a higher low, indicating decreasing downside momentum and a potential trend reversal. Conversely, a bearish divergence happens when security achieves a higher high, but the MACD forms a lower high, suggesting weakening upside momentum and the possibility of a trend reversal. It’s important to use caution when interpreting divergences, as they can occur in both strong uptrends and downtrends. Strong uptrends may have bearish divergences, while strong downtrends may exhibit bullish divergences. The key is to consider the context and other factors in your analysis to make well-informed trading decisions.
Kotak Mahindra Bank with Bearish Divergence
Asian Paints with Bullish Divergence
Disclaimer: This blog has been written exclusively for educational purposes. The securities mentioned are only examples and not recommendations. It is based on several secondary sources on the internet and is subject to changes. Please consult an expert before making related decisions.

