


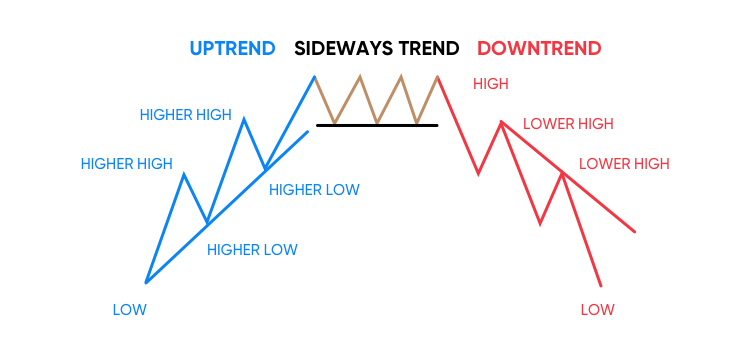
Before diving straight into the strategy let’s understand the foundations of charts to make easy use of strategy. Whenever there is a price chart, the price moves in 3 directions. Uptrend, Downtrend and Sideways or Ranging market. Whenever price continues in one direction it is said to be in trend, following some retracement into the same price movements. Further confirmation is given by the price moves by forming the higher highs and higher lows for an uptrend. On the other hand, lower lows and lower highs for down-trending markets. Trendline is the tool used to spot and indicate the trend.
The ranging market or Sideways trend is the 3rd type of trend where the price movement of a stock or index continuously moves to the right side with the indecision of direction. In such a scenario price follows an up and down swing without making new highs or new lows subsequently. The following image shows the trend and sideways markets.
VWAP (Volume Weighted Average Price) Indicator
As the name suggests it is an average price of stock weighted by total volume. The VWAP (Volume Weighted Average Price) trading strategy is a method used by day traders and short-term traders. It is primarily used to assess how well professional traders, like those working for investment banks and hedge funds, executed their large trades.
If they buy below VWAP, it’s considered a good trade because it’s cheaper than the market price. Conversely, if they sell above VWAP, it’s also seen as a good trade. VWAP helps traders identify market trends, acts as a support/resistance level, and can be used to make entry and exit decisions.
How VWAP is Calculated
Step 1: Calculate the average price of the stock
Formula – High + Low + Close/3 = Average Stock Price
Step 2: Multiply Average Stock Price by Volume
Average Stock Price * Volume
Step 3: Divide above multiplication by Total Volume to arrive at VWAP
Cumulative (Average Stock Price * Volume) / Cumulative Total Volume =VWAP
Following is the Example of VWAP calculation in Excel for ITC Ltd.

In a trending market, the price tends to stay either above or below VWAP. When it’s above, it means buyers are in control, and when below, sellers dominate. However, in a ranging or sideways market, the price hovers around VWAP. It’s important not to trade right at the market open because there’s usually a lot of volatility as overnight shareholders and new investors interact.
Once the market settles a bit, you can use VWAP to identify the market trend. For a trending session, you look for strong moves away from VWAP, and for a ranging session, you see price action staying near VWAP.
However, there are limitations to this strategy. VWAP may lag as the day progresses, so it’s less effective later in the day. It’s also not very useful right at the market open due to high volatility. Successful VWAP trading requires additional factors like price action and volume. The strategy suggests buying when the price is above both VWAP and the previous day’s VWAP, and selling when the price is below both.
Following are a few examples that show how can we use VWAP indicators to trade in the market:
Hindalco
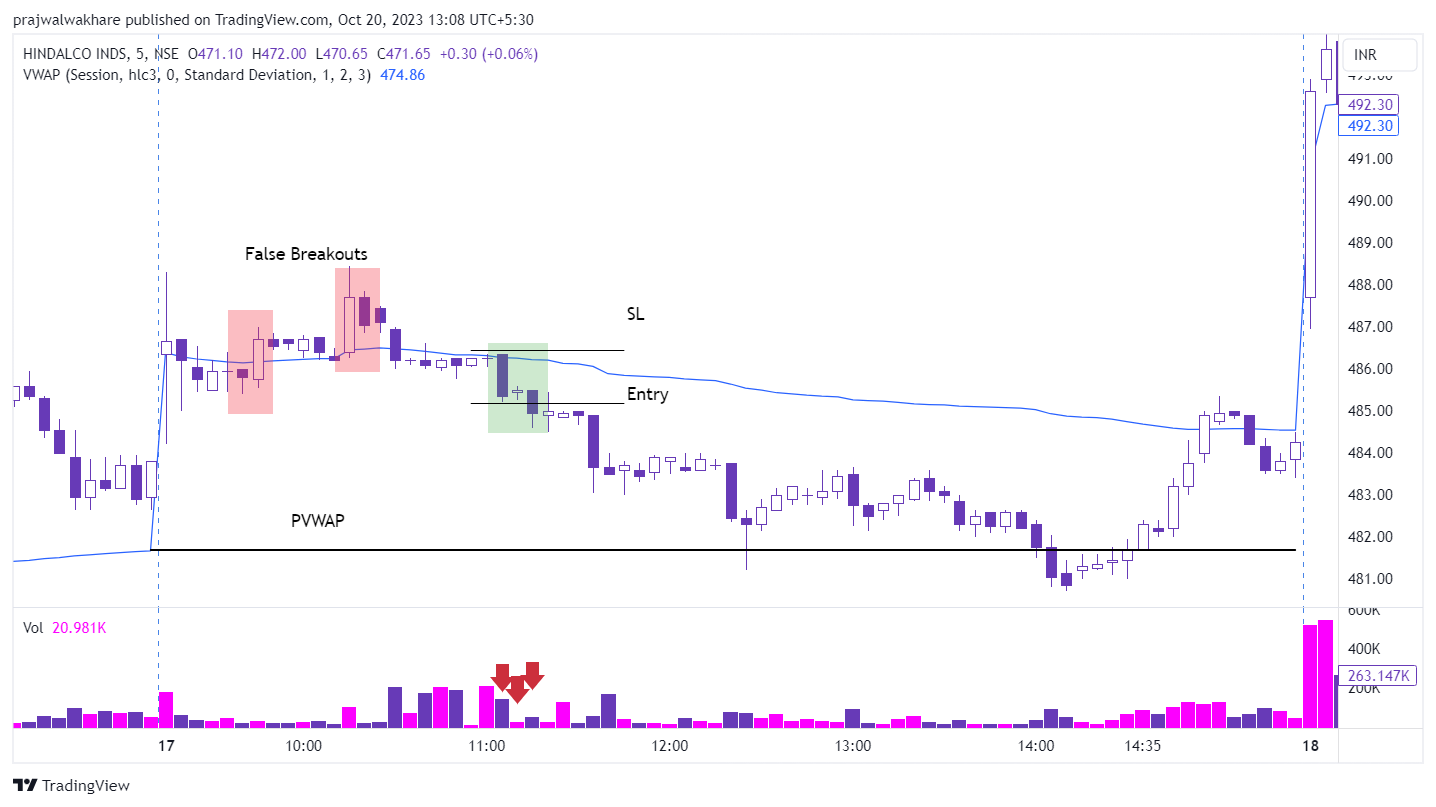
In the chart depicting Hindalco Industries, the market opened with an indecision candle, with the price hovering around the VWAP. This indicated false breakouts, as the price failed to follow through. Following the first market session, Hindalco’s share price experienced a downside breakout of the VWAP, supported by low trading volumes. The entry and stop-loss levels for the trade are illustrated in the chart. Following the successful breakout, the price continued towards the PVWAP, where it found strong support. The price action formed a hammer candlestick pattern in response to this support level.
Read: Master Candlestick Patterns
In the subsequent market session, the price remained range-bound, and towards the end of the trading hours, it reversed from the PVWAP back to the VWAP.
Adani Ports
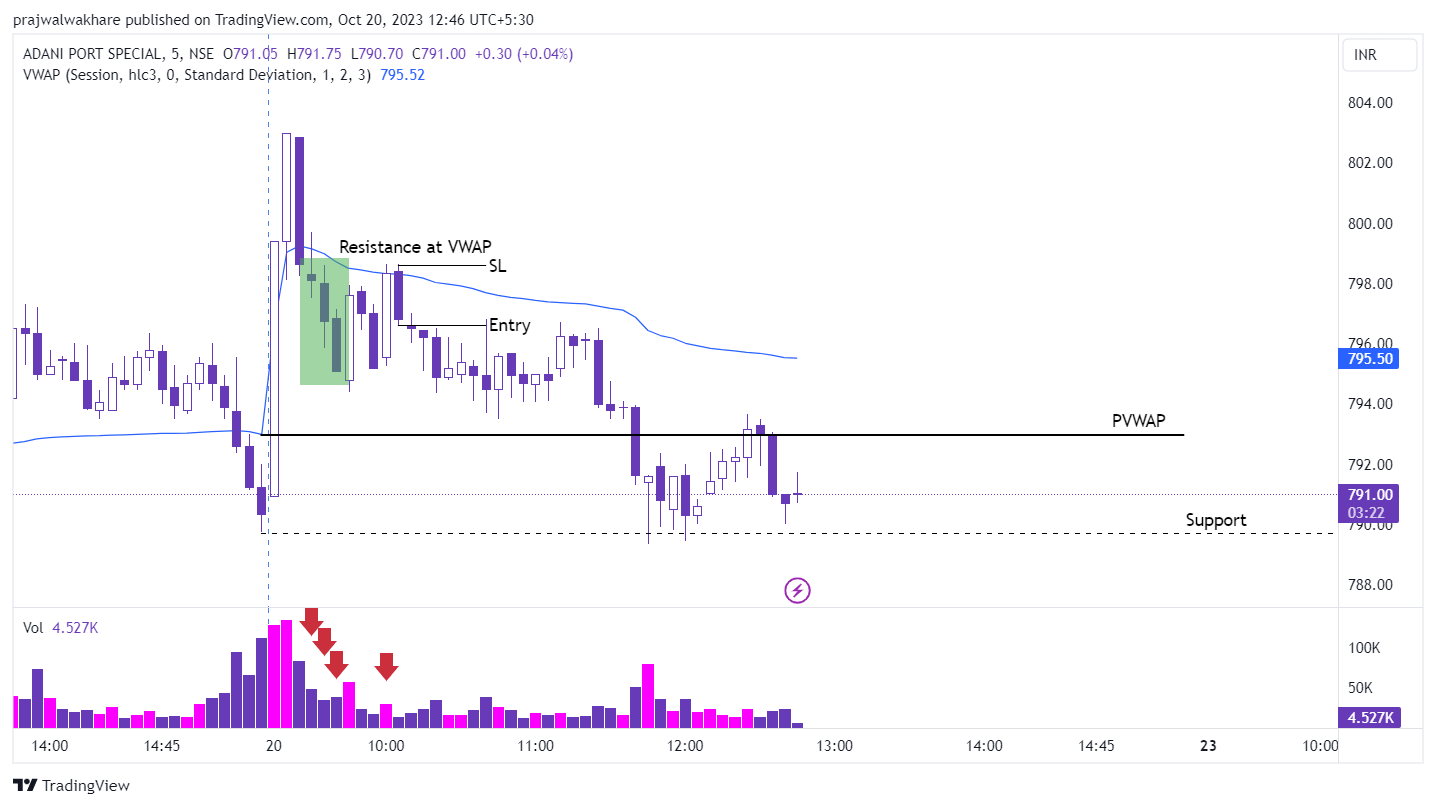
Adani Ports stock displayed significant volatility during the opening session, reaching a high of Rs 803.00. However, as the trading day progressed, the volume declined, and the price dropped below the VWAP level. This decline was confirmed by the presence of three strong red candles, indicating a forthcoming downtrend. The entry point and stop loss are clearly indicated in the chart. The first target is set at the PVWAP, and the second target is the previous day’s low. If the price manages to close below the support level at Rs 789.70, it is likely that the stock will continue its downward movement until the market closes. On the other hand, there is a possibility that the price may become trapped within the range defined by the support and PVWAP. In such a scenario, the stock could consolidate until either the bears or the bulls regain control of the market.
SBI Life
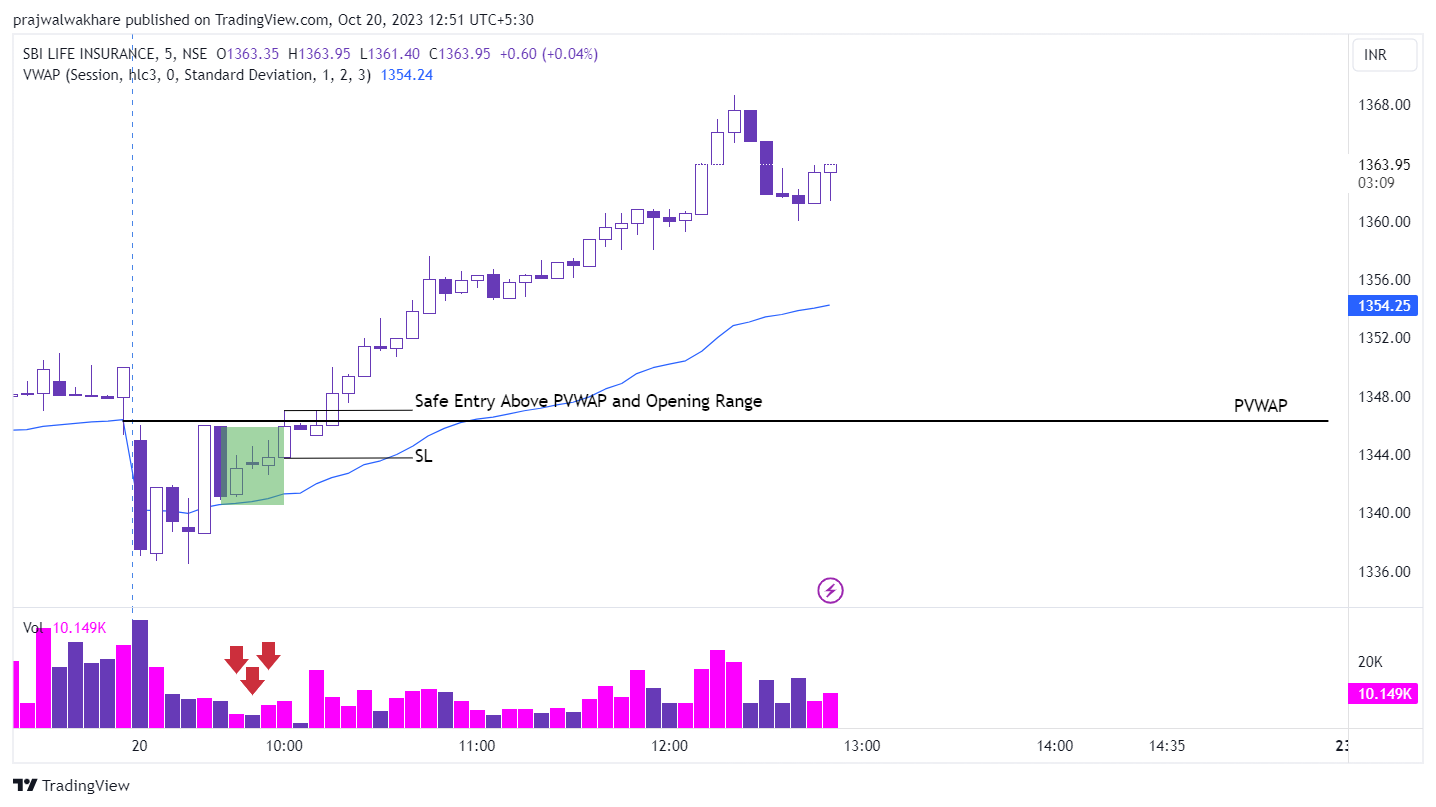
SBI Life’s charts show an unstoppable rally today. As seen in the chart above, after the opening, the stock price showed a strong upward movement with solid green candles and high trading volumes. During a volatile trading session, the stock price moved above both VWAP and PVWAP, confirming a breakout. This confirmation was through the presence of three consecutive green candles above VWAP, supported by lower trading volumes on these same candles.
Read In Detail: The Importance Of Tracking Volume In Trading
In the provided chart, we can identify a safe entry point and set a stop loss. However, following the breakout, SBI Life displayed a highly bullish trend.
Dr Reddy
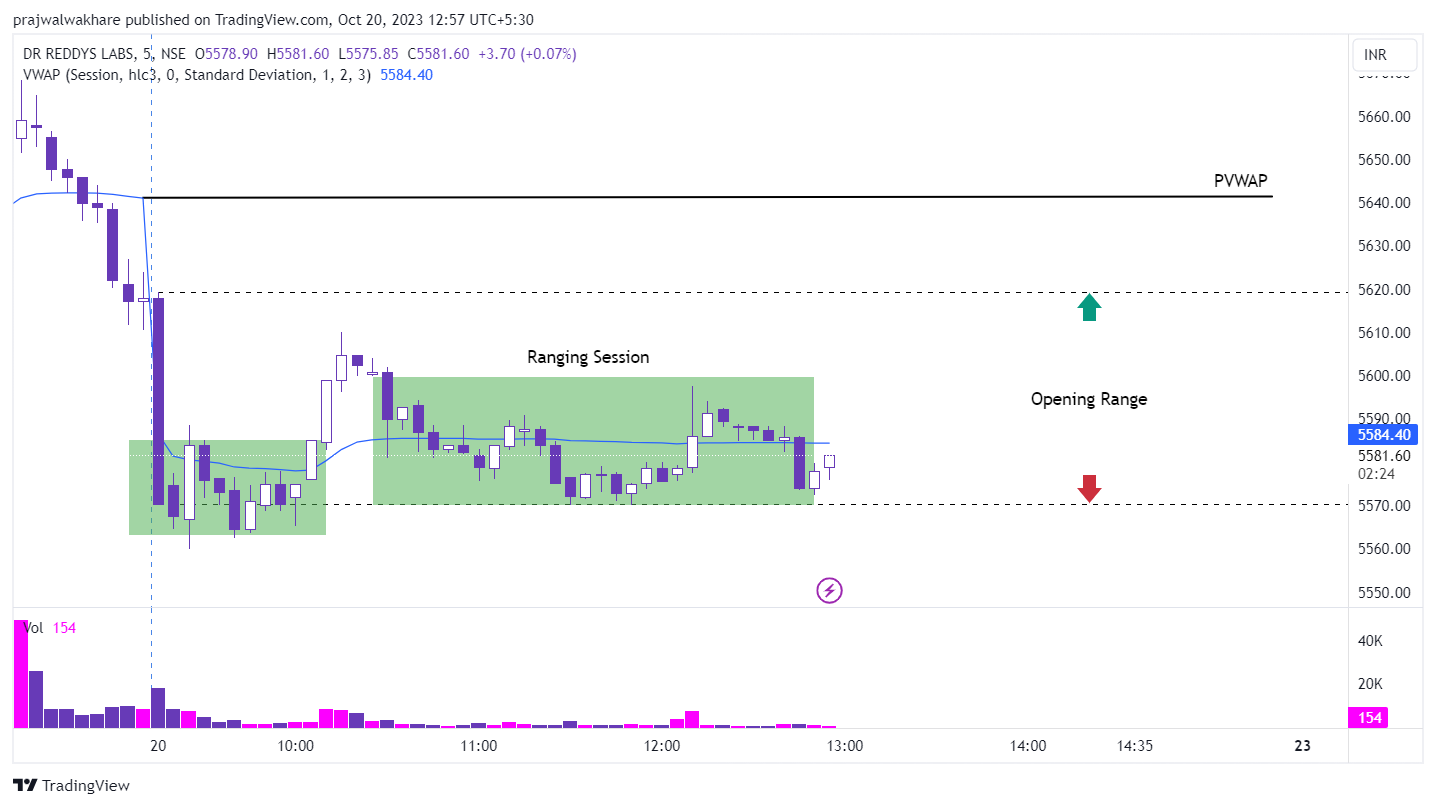
In the above chart, Dr Reddy’s lab performed a range-bound session, as it failed to break and sustain below the opening range of the day. The price consolidated around VWAP stating the absence of institutional trades. It is advised to stay away from these price actions as it won’t fetch any returns from trading in such price action.
Reliance Industries
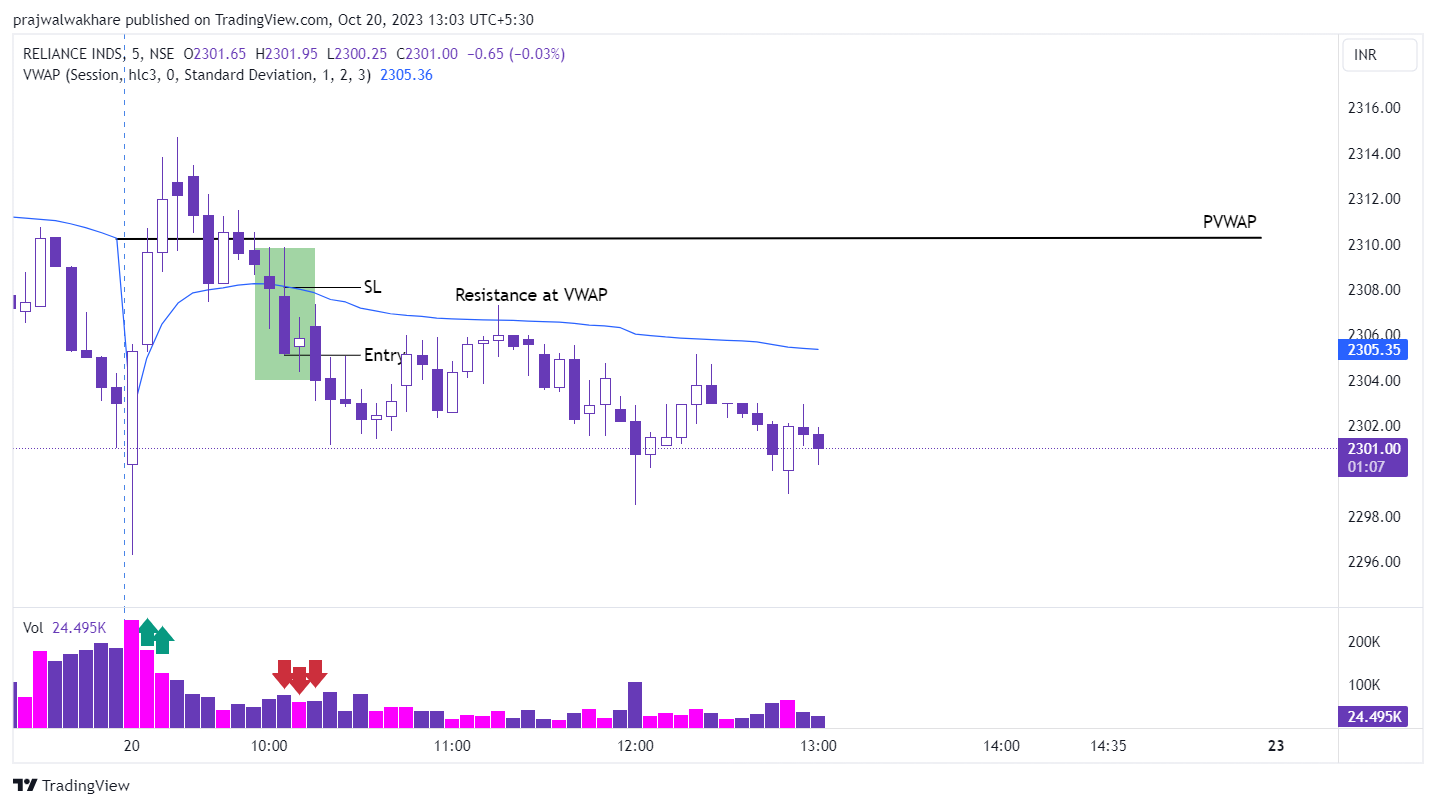
The chart of Reliance Industries gives a good example of a VWAP strategy. In the opening session, the price exhibited volatility and managed to surpass the PVWAP level but was unable to maintain that position. Subsequently, the stock price broke below the VWAP, confirming a downtrend. This was supported by a substantial red candle that shaded the buyers at the higher levels. Moreover, the volume on the lower levels favoured the direction of the stock price.
Following the entry point, the price attempted to retest the VWAP, which acted as resistance and contributed to a continued downtrend. This was confirmed through the formation of lower lows and lower highs. If the price manages to close below today’s low, it might indicate a further decline in Reliance Industries during the closing session, although the probability of this occurring is relatively low.
Disclaimer: This blog has been written exclusively for educational purposes. The securities mentioned are only examples and not recommendations. It is based on several secondary sources on the internet and is subject to changes. Please consult an expert before making related decisions.

