


In the world of the capital market, various strategies and methods are employed to make investment and trading decisions based on stock prices. Market experts often advise finding a method that suits your individual preferences and helps you control your emotions. One such method relies on the Relative Strength Index (RSI) indicator to determine stock price trends and make informed decisions about buying, selling, or holding securities.
Relative Strength Index (RSI)
Before delving into this trading and investing method, let’s first understand the RSI indicator. The Relative Strength Index (RSI) is a powerful tool used in stock market analysis. It gauges the recent price movements of a stock to determine whether it might be overvalued (overbought) or undervalued (oversold).
Welles Wilder Jr. introduced this tool to the financial world. An RSI reading of 70 or above serves as a warning that an investment may be becoming too expensive, signaling a potential price decrease and a shift in the trend. Conversely, when the RSI is at 30 or lower, it indicates that the market is undervaluing the stock, possibly presenting a good buying opportunity. In simple terms, the RSI helps investors identify when a stock may be overpriced (above 70) or attractively priced (below 30).
According to the Charted Market Technician (CMT) Association, the Relative Strength Index (RSI) is a technical momentum indicator that assesses recent gains and losses to identify overbought and oversold conditions of an asset. It is calculated using the formula:
RSI = 100 – 100 / (1 + RS)
Where,
RS = Average of X days’ up closes / Average of X days’ down closes
Read: RSI Trading Strategies
Understanding the RSI Range Shift Concept
The RSI Range Shift concept involves changes in the RSI indicator’s behavior. These changes occur when the RSI transitions from one predefined range to another due to the movement of a security’s price. There are five distinct sets of ranges for the RSI:
- Super Bullish Range – 60-80
- Bullish Range – 40-80
- Bearish Range – 20-60
- Super Bearish Range – 20-40
- Sideways Range – 40-60
This concept is applicable to all types of charts, whether they pertain to indices, stocks, commodities, currencies, and more.
Bullish Ranges (Super Bullish and Bullish Range Example)
In the Bullish Range, the RSI typically oscillates between the 40 and 80 zones. When the RSI reaches 40, it is considered to be in an oversold territory, indicating a potential buying opportunity. On the other hand, when the RSI hits 80, it is seen as overbought, suggesting a potential correction in the market. In the Super Bullish Range, the RSI tends to fluctuate between 60 and 80. When the RSI is in the 60-65 range, it is often seen as an opportune time to consider buying, as it may signal a potential market rebound.
Example: BPCL

In the provided example, a Bullish Range is highlighted within a light green box. Within this range, the RSI typically moves between 40 and 80. When the RSI hits 40, it’s considered oversold, and as seen in the example, this often results in a price rebound with upward momentum. In the case of the Super Bullish Range, marked by the dark green box, the RSI behavior shows a range between 60 and 80, indicating a strong and consistent upward trend.
Sideways Range
In the Sideways Range, the RSI typically moves between the 40 and 60 zones. This behavior suggests that the asset or market is in a sideways or range-bound phase. During this time, trading can be uncertain and may experience quick reversals (whipsaws). Therefore, caution is advisable, and it may be best to avoid trading when the RSI is within the Sideways Range.
Example: SBI Life
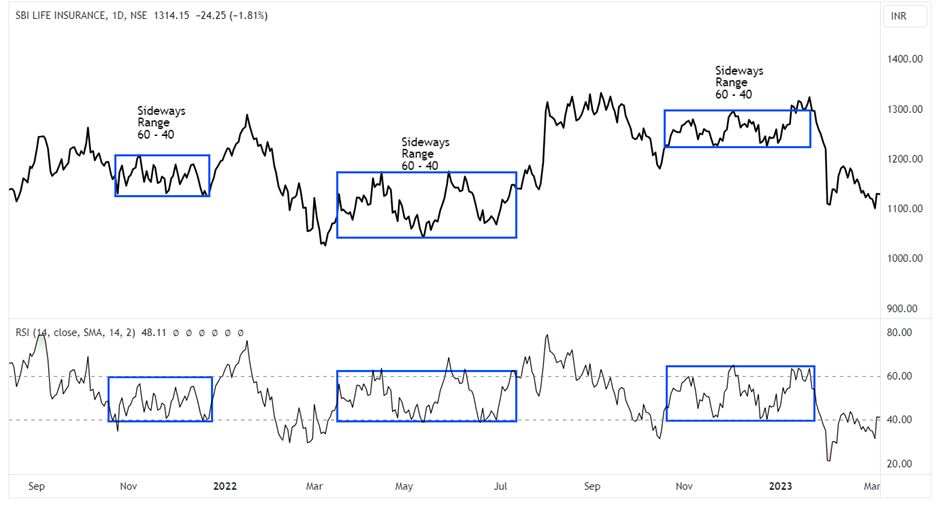
In the example of the Sideways Range highlighted within the blue box, the RSI typically oscillates between the 40 and 60 zones. Traders often experience a lot of whipsaw action during this phase as the stock price remains relatively flat and lacks a clear trend in either direction.
Bearish Range (Bearish and Super Bearish Range Example)
In the Bearish Range, the RSI typically fluctuates between 20 and 65. When the RSI hits the 60-65 zone, it’s considered overbought, suggesting it might be a good time to sell, with target levels at 40 and 20 on the RSI. When the RSI drops to 20, it’s seen as oversold, indicating an opportunity to enter a long position for a potential price rebound. In the Super Bearish Range, the RSI tends to stay between 20 and 40. When it reaches the 40 level, it’s often considered a selling point, with a target set at 20 on the RSI.
Example: Ultratech Cement
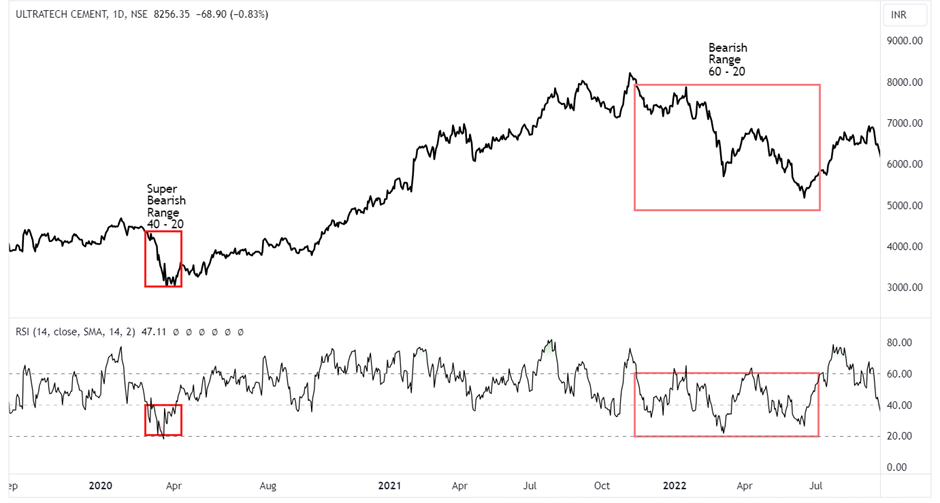
In the example above, the Bearish Range is marked in a light red box, where the RSI tends to oscillate between 20-60 zones, with a margin of +/-5. As observed in the chart, as soon as the RSI touches the upper band of this range, the price forms lower highs and starts correcting. The Super Bearish Range is marked in a dark red box, where the RSI oscillates between 20-40 zones, and the price moves downwards with accelerated speed.
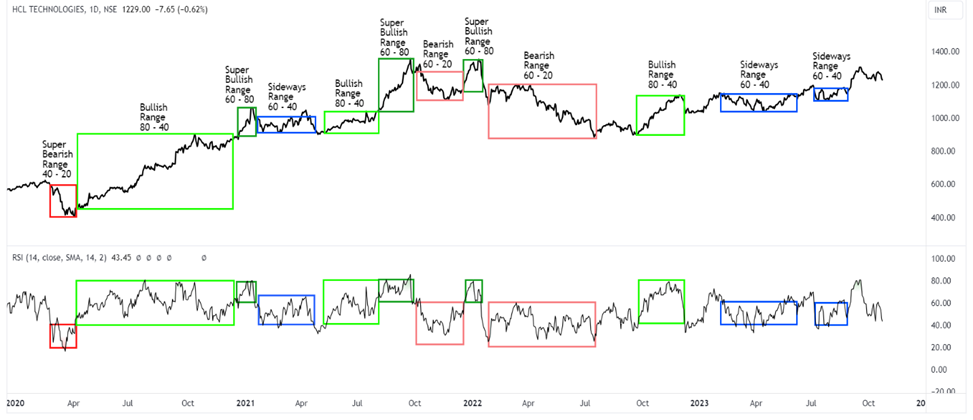
The daily chart of HCL Tech spanning from January 2020 to October 2023 reveals the distinct ranges and corresponding trends that the stock has been following during this period.
Disclaimer: This blog has been written exclusively for educational purposes. The securities mentioned are only examples and not recommendations. It is based on several secondary sources on the internet and is subject to changes. Please consult an expert before making related decisions.

