


Opening Range Breakout” is a popular intraday strategy among the trader community. The strategy typically unfolds early in the morning, which is why most traders prefer lower timeframes such as 5 minutes and 15 minutes for breakout range analysis. However, the opening range breakout strategy can be applied to any timeframe, ranging from 5 minutes to 60 minutes. This strategy is most effective in trending markets rather than in range-bound conditions.
How to Use Opening Range for Trading:
As the market opens, the initial session tends to be highly volatile and often sets the intraday market direction. On the selected timeframe chart, the high and low of this initial session are marked. Whenever the price crosses these levels during the trading day, it signals a trading opportunity. Conversely, during choppy market conditions, the price may encounter resistance at the high or low of the opening range, indicating an opportunity for a counter-trend trade.
The following image displays the Opening Range on a 15-minute timeframe chart:
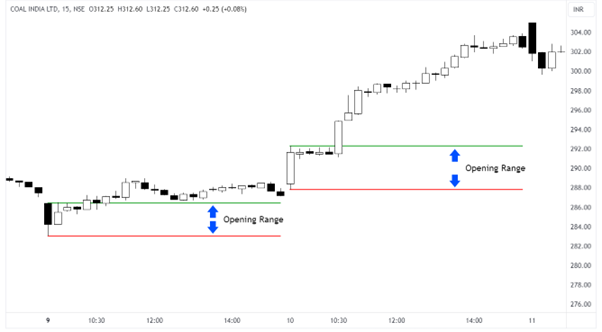
In the chart example, you can see that the Opening Range is marked on the first candle of the day. The high of the candle is marked as the upper limit of the opening range, and the low of the first candle is marked as the lower limit of the range on the 15-minute chart. When the price breaks and manages to close above or below the opening range, it is suggested to take a trade in the same direction to ride the trend.
Here are a few examples of Opening Range Breakouts:
ICICI Bank Chart (5-min)
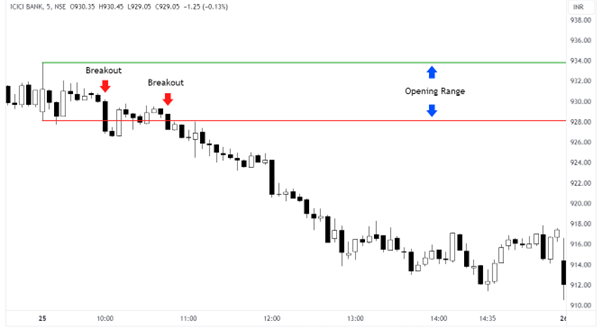
As shown in the ICICI Bank chart above, it experienced two breakouts from the lower limit of the opening range, and the trend continued. This serves as a simple and straightforward example of an Opening Range Breakout.
Hindalco Ind (15-min)
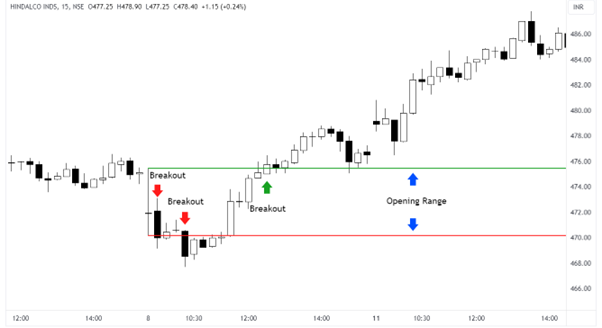
In the chart above, the downside breakout turned out to be a false signal, as the price returned to the Opening Range. However, after the first half of the trading session, the price broke to the upside. The uptrend continued into the next day, resulting in substantial profits for buyers. Notably, the Opening Range also acted as support and resistance for subsequent price action.
Nifty 50 (5-min)
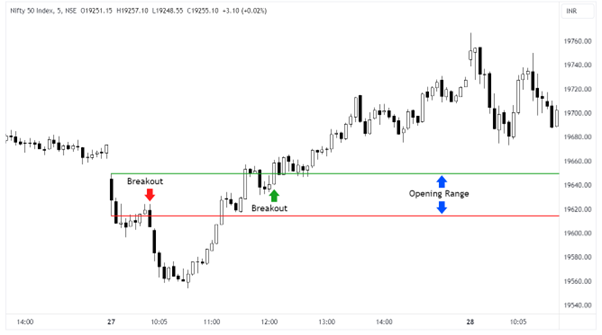
The Nifty 50 chart above shows breakouts on both sides, with targets being reached in both directions.
Things to consider before trading Opening Range Breakouts:
- Security Selection
- Timeframe
- Entry and Exit Rules (Fibonacci Levels)
Read: What are Fibonacci Retracement Levels?
- Technical Analysis (price action)
- Market Conditions
- Volume Analysis
- Trending Price
- Medium Opening Range

