


There are two types of chart patterns in technical analysis, one is reversal chart pattern and the second is the trend continuation chart pattern. In this article, we will discuss about the most famous reversal chart pattern known as the head and shoulder reversal chart pattern.
The Head and Shoulder reversal pattern emerges following an uptrend and signals a trend reversal. It consists of three consecutive peaks, with the central peak (the head) being the highest, and the two outer peaks (the shoulders) being lower and roughly equal in height. The reaction lows of these peaks can be connected to form a support line, known as the neckline. This pattern also involves elements like volume, a breakout point, a price target, and the transformation of prior support into resistance.
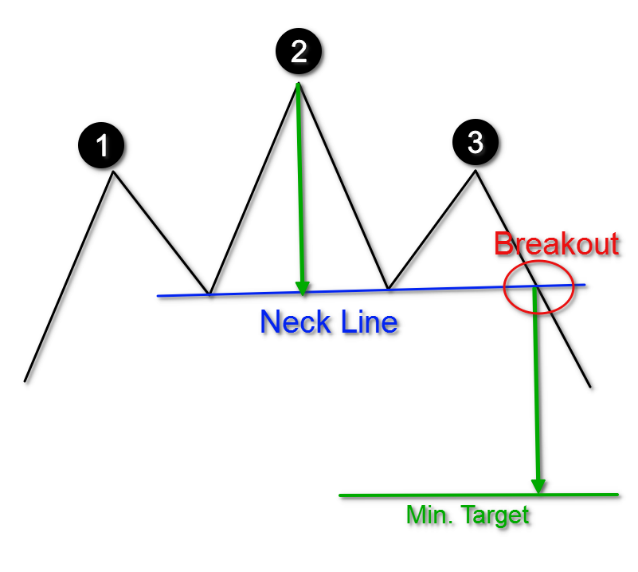
This pattern consists of four distinct elements, and I’ll describe a Head-and-Shoulders Top for illustration:
- Prior Uptrend: The pattern requires a prior uptrend to reverse. Without a prior uptrend, there cannot be a Head and Shoulders reversal pattern.
- Left Shoulder: This is the first part of the pattern. It forms a peak in the existing uptrend, followed by a decline. The decline typically stays above the trend line, maintaining the uptrend.
- Head: The head comes after the left shoulder, with a peak that exceeds the previous high. The subsequent decline from the head usually breaks the uptrend line.
- Right Shoulder: The right shoulder follows the head and is characterized by a lower peak, often aligning with the left shoulder’s high. The decline from the right shoulder should break the neckline.
- Neckline: This line is formed by connecting low points 1 and 2, marking the end of the left shoulder and the head, and the beginning of the right shoulder. The slope of the neckline affects the pattern’s bearishness.
- Volume Confirmation: Volume is essential for confirmation. Higher volume during the left shoulder’s advance compared to the head’s advance is a warning sign. Further warnings come with increased volume during the head’s decline and decreased volume during the right shoulder’s advance. The final confirmation is increased volume during the right shoulder’s decline.
- Neckline Break: The pattern is not complete until the neckline support is convincingly broken, often accompanied by an expansion in volume.
- Support Turned Resistance: After the support is broken, it can become resistance. There may be a return to this level, offering a second chance to sell.
- Price Target: To estimate the potential price decline after the neckline break, measure the distance from the neckline to the head’s peak and subtract it from the neckline. This serves as a rough price target, but other factors like previous support levels, Fibonacci retracements, or moving averages should also be considered.
Read: What are Fibonacci Retracement Levels?
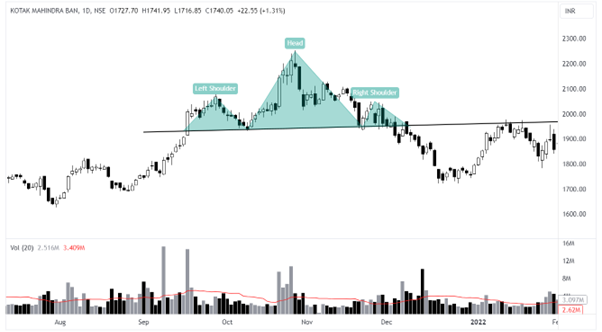
Kotak Mahindra Bank exhibited a Head and Shoulders reversal pattern with a slightly upward-sloping neckline. Here are the key observations:
- The left shoulder ended with a low at 1930, transitioning into the head.
- While the stock advanced, the volume remained relatively high as robust as during the left shoulder’s ascent.
- Volume continued to decline until the neckline was breached
- The decline from 2100 to 1930 constituted the second low point.
- During the descent of the right shoulder and the break of the neckline, the volume expanded.
- There was a temporary rebound to the neckline break.
- The distance from the neckline to the head’s top was 260 points on a closing basis. With the neckline breaking in 1950, this suggested a move to around 1650. In March 2022, the stock reached a low of 1670. After declining in 1970.
Inverted Head and Shoulder Chart Pattern
The inverted head and shoulder pattern is the reverse of the traditional head and shoulder pattern. It typically signals a bullish reversal in the price trend. This pattern consists of three lows, with the central low known as the Head being lower than the two surrounding lows known as shoulders. A breakout above the neckline in an inverted head and shoulders pattern often indicates a potential upward price movement. Traders often view this pattern as a sign of a potential trend reversal and an opportunity for long positions in the market.
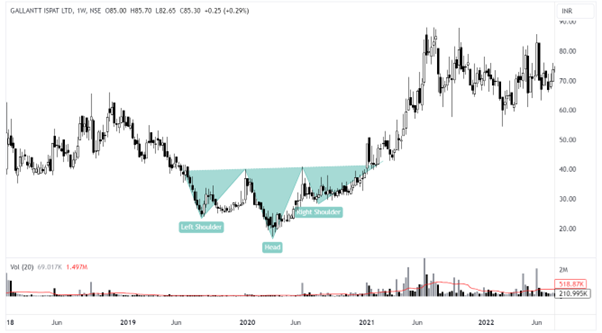
Gallant Ispat exhibited an Inverse Head and Shoulders reversal pattern with a slightly upward-sloping neckline. Here are the key observations:
- The left shoulder ended with a high at 40, transitioning into the head.
- While the stock declined, the volume remained relatively low.
- Volume peaked when the neckline was breached
- The surge from 18 to 40 constituted the second high point.
- During the end of the right shoulder and the break of the neckline, the volume expanded.
- There was a temporary rebound to the neckline break.
- The distance from the neckline to the head’s top was 23.50 points. With the neckline breaking at 40, this suggested a move to around 63.50 where In July 2021, the stock reached a high of 88.
The head and shoulder pattern is a common reversal formation that typically follows an uptrend and signals a significant trend reversal upon completion. While it’s ideal for the left and right shoulders to be symmetrical, it is not mandatory. Recognizing the neckline support and confirming the breakout with increased trading volume is crucial. A support break signifies a shift in selling willingness at lower prices, often leading to a supply increase.
The ensuing combination can be impactful, and there might not be a second chance to return to the support break. While measuring the expected post-breakout decline can be useful, it shouldn’t be solely relied upon for the final target, as other technical aspects may gain importance as the pattern develops.
Disclaimer: This blog has been written exclusively for educational purposes. The securities mentioned are only examples and not recommendations. It is based on several secondary sources on the internet and is subject to changes. Please consult an expert before making related decisions.

