


What is the Rounding Bottom Pattern?
Stock price forms many more patterns with their price movement. Some create bullish signs some create bearish signs. Rounding bottom is a bullish pattern which creates round arc like structure within price movement. Generally, it forms at the bottom level of price levels, near support levels as it also confirms the potential scope for stock price performance. A rounding bottom is a U-shaped trough, also known as a saucer.
Formation of Pattern
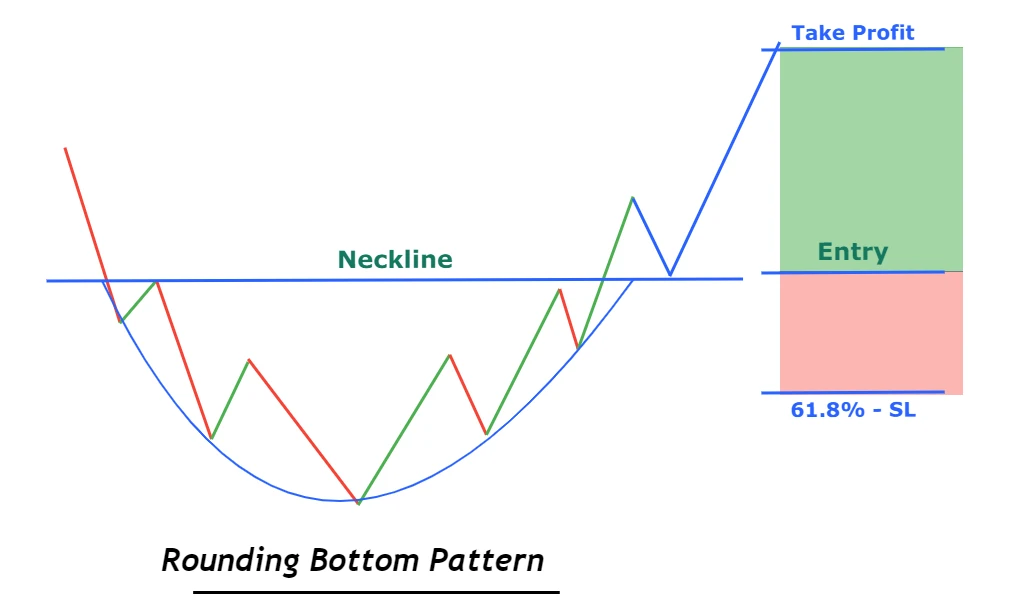
The preceding price trend should be a downtrend, marked by lower lows and lower highs in its price action. The price should continue to drop until it finds support, leading to a gradual decrease in the rate of descent. Subsequently, it should begin to form an arc, moving horizontally and indicating an impending upward shift, all without abrupt price fluctuations. Ultimately, the price establishes a low point and gains a slight upward momentum, mirroring the previous decline. This results in the formation of a symmetrical U-shaped pattern on the chart.
At the onset of the sharp decline, this pattern creates a resistance level, which forms the upper part of the rounding bottom. As the price gains volatility, it breaks through this resistance with conviction, signalling a breakout of the rounding bottom pattern. This is the opportune moment for investors or traders to enter the stock, aiming to secure healthy profits. The target price is typically set at the height of the rounding bottom pattern, and the stop-loss level may depend on candlestick formations but is generally placed at the Fibonacci level of 61.8% of the rounding bottom chart pattern.
Read: Master Candlestick Patterns
Volume plays a significant role in this chart pattern. After forming the pattern’s low point, the uptrend should be accompanied by increasing volume, confirming the validity of the rounding bottom chart pattern.
Following are some recent examples of Rounding bottom formation:
Axis Bank
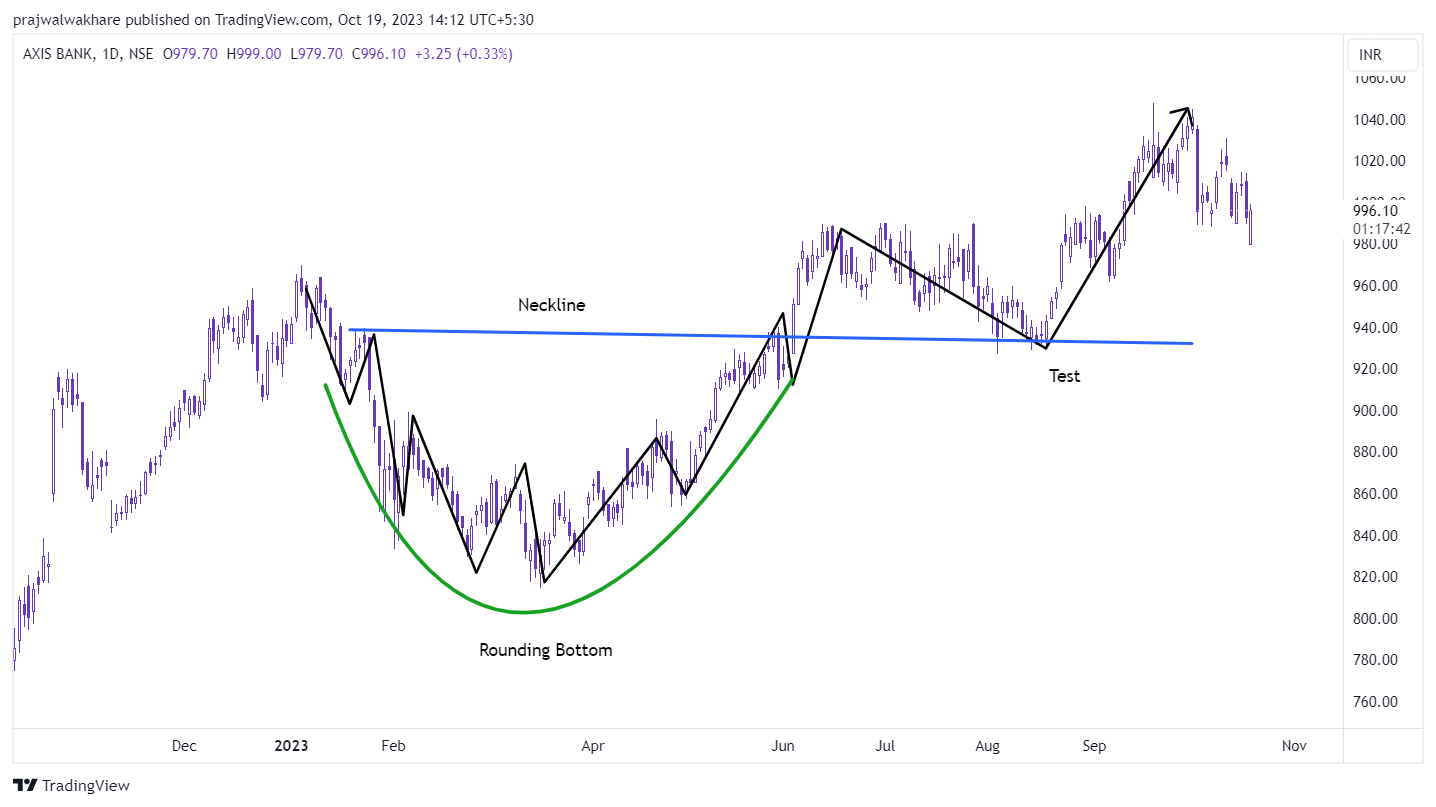
Axis Bank’s stock formed a rounding bottom chart pattern in the first half of the year. As depicted in the chart, the price experienced a breakout in the month of June, followed by a period of consolidation. It tested the neckline level, which effectively acted as a support for the price. After finding support at this level, the stock price surged by over Rs 100 per share.
SAIL India
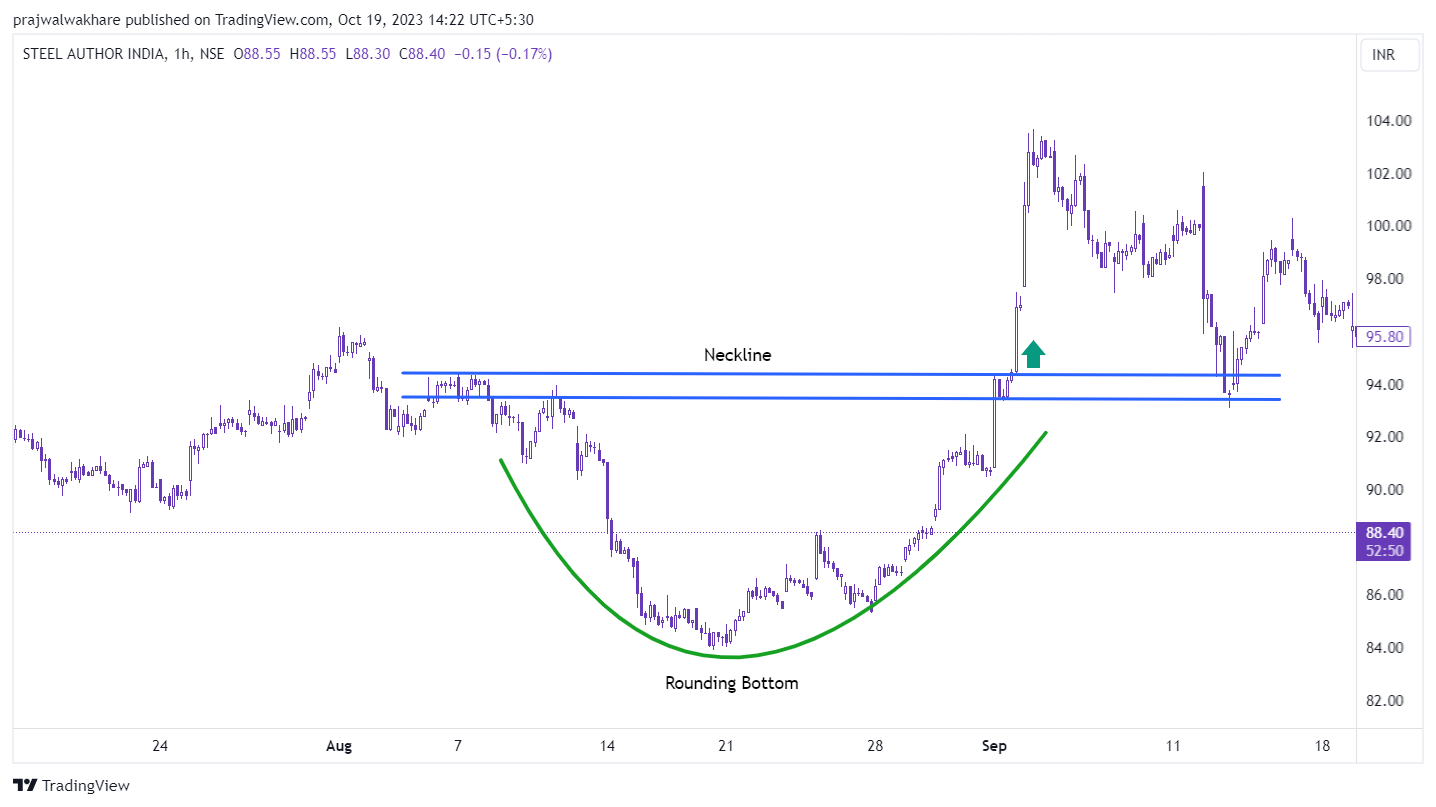
The chart of SAIL India exhibited a rounding bottom pattern on a 1-hour chart, which led to a highly volatile breakout in its price action. The stock experienced a decline on the 12th of August 2023, formed a bottom on the 21st of August 2023, and subsequently broke out during the early weeks of September.
Bharti Airtel
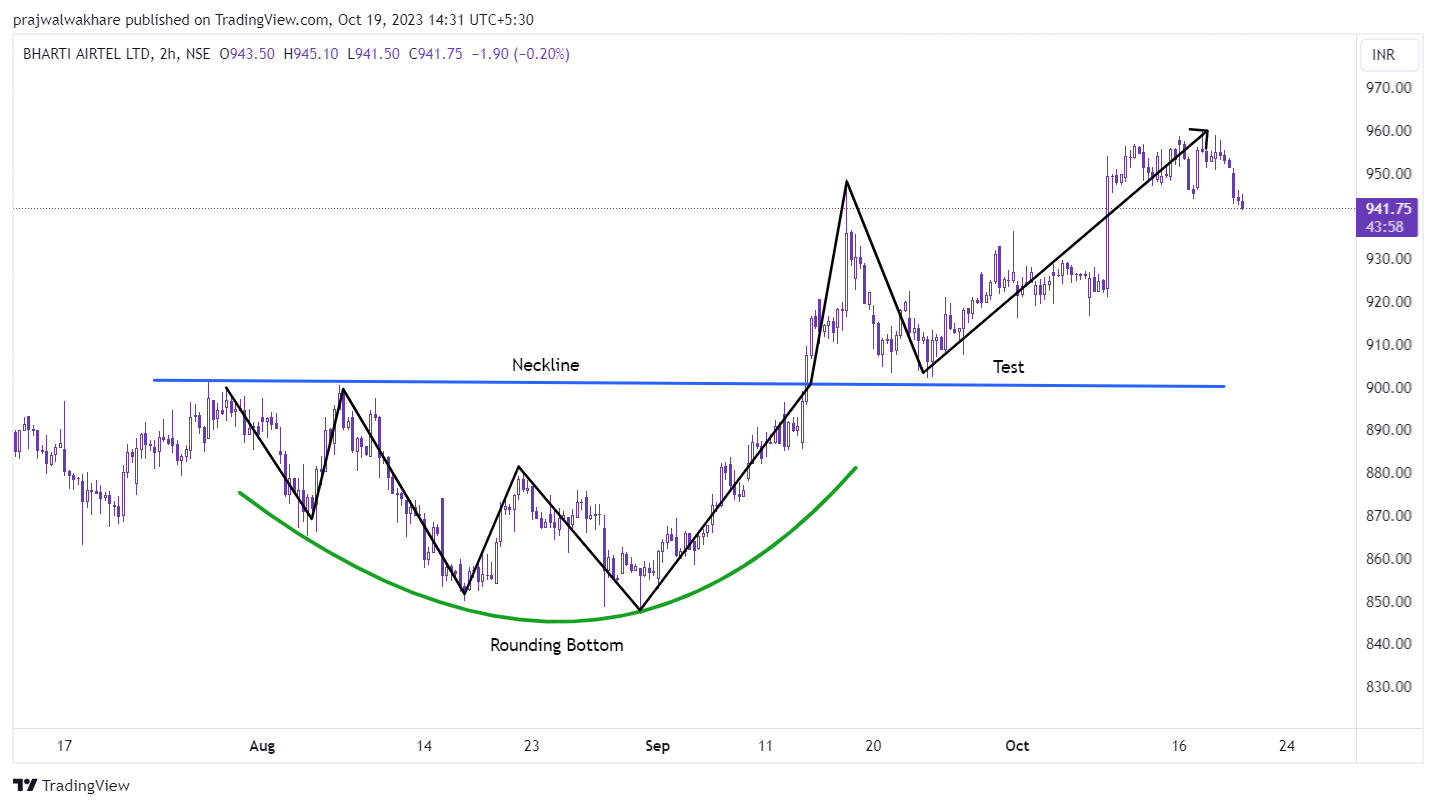 In August and September, the Bharti Airtel stock displayed a rounding bottom pattern, which subsequently experienced a breakout in mid-September. Presently, the stock price is in an uptrend after testing the neckline. It appears that the price may find support once more and potentially establish a new higher high. The chart provided above depicts this price action on a 2-hour timeframe.
Disclaimer: This blog has been written exclusively for educational purposes. The securities mentioned are only examples and not recommendations. It is based on several secondary sources on the internet and is subject to changes. Please consult an expert before making related decisions.

