


The Central Pivot Range (CPR) is a technical analysis indicator used to identify key support and resistance levels in the financial markets. It is calculated using the previous day’s high, low, and close prices. The CPR is a popular indicator among day traders, as it can help them identify potential entry and exit points for their trades. The CPR can also be used to identify potential trends in the market, as prices often tend to respect the CPR levels.
The CPR consists of three components
- Pivot
- Bottom Central Pivot (BC)
- Top Central Pivot (TC)
How to calculate CPR?
The CPR indicator incorporates the charting of three price levels based on predetermined equations. For this, the trader must use the stock’s highest, lowest, and closing levels from the previous trading day. The purpose of applying the previous day’s needed levels for the next schedule is to comprehend and forecast the price movement of the stock based on the previous day’s performance.
The three levels of the CPR indicator and the formula to calculate them are mentioned hereunder.
- Pivot point = (High + Low + Close) / 3
- Top Central Pivot Point (BC) = (Pivot – BC) + Pivot
- Bottom Central Pivot Point (TC) = (High + Low) / 2
Interpretation of CPR Indicator
Interpreting the Central Pivot Range (CPR) can provide insights into the market’s direction, whether bullish or bearish.
- An upward trend in the CPR line suggests a bullish market, while a downward trend indicates a bearish market.
- Virgin CPR: If the stock price doesn’t cross the CPR lines, there’s a 40% chance it won’t break through the CPR range the next day.
- Price above TC level: A buying trend suggests traders may buy stocks despite the higher average price. CPR acts as support.
- Price below BC level: A seller’s market indicates buying opportunities. CPR acts as resistance.
- Price within CPR lines: The stock market is in an accumulation period. Traders may wait for a CPR breakout with a volume above TC.
- Wider CPR: Buy at the intended Top Central Pivot Point (TC) while maintaining the Bottom CPR Point (BC).
Also Read: Intraday Trading with Pivot Points
CPR Intraday Trading Strategy
Narrow CPR trading strategy identifies stocks that have consolidated or moved sideways in the previous trading period and are likely to experience a breakout and trending move in the current period.
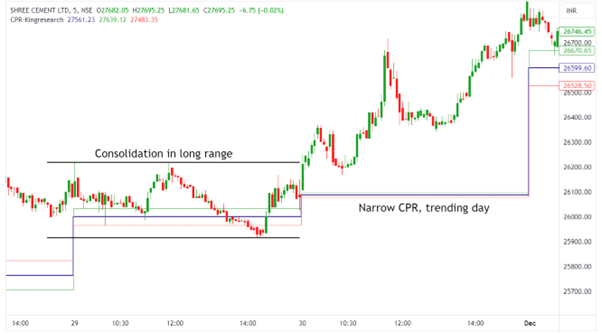
Shree Cement 5-min chart
A medium-range CPR indicates that the security may or may not trend.
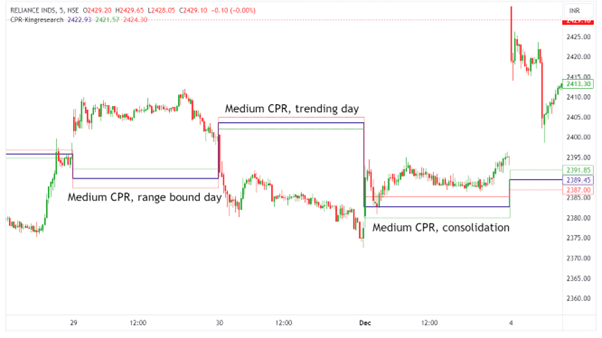
Reliance Industries 5-min chart
Wide Range CPR Trading Strategy: When the CPR is wide, it suggests a sideways or range-bound day.
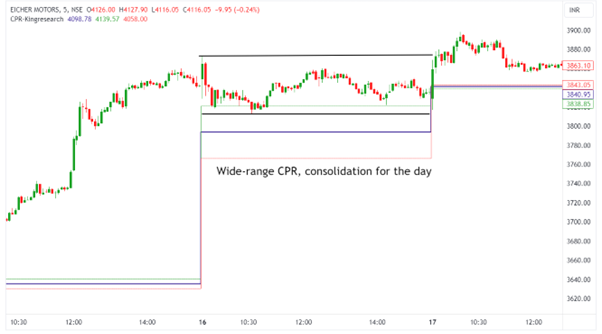
Eicher Motors 5-min chart
Read: Intraday Trading – Mastering the Art of Maximum Profits

