


Pivot point is a technical indicator used by day traders based on the high, low and close of the previous session. It is used to arrive at potential resistance and support levels of the next trading sessions which are likely to be. Traders use this technic to make decisions like entry, exit and stop loss of the trades. This is an intraday tool created by day traders to bring discipline and accuracy into trading with possible price level anticipation.
Pivot points can be applied like conventional support and resistance levels. Unlike dynamic indicators, pivot points remain constant throughout the trading session, offering traders a strategic advantage for planning their actions, initiating trades in a more disciplined way, and potentially increasing profitability. The fundamental guideline indicates that when the price falls below the pivot point, traders tend to consider entering short positions. Conversely, if the price of an asset surpasses the pivot point, traders are inclined to contemplate opening long positions.
Pivot points is a type of predictive (also known as leading) indicator. It is crucial to remember that not every prediction will come to pass. That’s why it’s advised to use this tool in conjunction with other indicators, like the Moving Average and Fibonacci Retracement, to maximize its effectiveness.
There is a formula used to get a pivot point of the previous day which is further required to determine the resistances and supports of the day. The pivot point indicator represents 7 levels on the chart: the pivot point line itself, 3 resistance lines, and 3 support lines.
Pivot point (P) = (Previous High + Previous Low + Previous Close)/3
Pivot point (P) is a middle line on the chart.
- S1= (P x 2) – Previous high
S1 is the first pivot level below the basic pivot point.
- S2 = P – (Previous High – Previous Low)
S2 is a pivot level below the support 1 line or the second line below the basic pivot point.
- S3 = Previous Low – 2(Previous High – P)
S3 is a pivot level below the support 2 line or the third line below the basic pivot point.
- R1 = (P x 2) – Previous Low
R1 is the first pivot level above the basic pivot point.
- R2 = P + (Previous High – Previous Low)
R2 is a pivot level above resistance 1 or the second line over the basic pivot point.
- R3 = Previous High + 2(P – Previous Low)
R3 is a pivot level above resistance 2 or the third line over the basic pivot point.
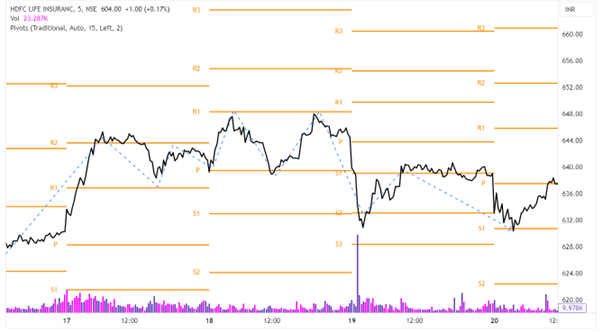
In the above chart of HDFC Life Insurance standard pivot points are plotted. The blue dotted line clearly depicts the picture that how price follows the resistances and supports provided by pivot point calculations. This easily helps the trader to decide whether to long or short on security.
The above pivot points are calculated by using the standard pivot method where there are a few others which are shown below.
Fibonacci Pivot Points
Fibonacci retracements, a widely recognized tool in trading, can be synergistically integrated with pivot points to create a strong level of strategy. The computation of Fibonacci pivot points closely resembles that of standard pivot points, yet with subtle variations. In this approach, the initial step involves determining the central pivot value, denoted as P, which entails summing the high, low, and close prices from the preceding day, followed by dividing this sum by 3. However, it is crucial to note that the formulas for establishing support and resistance levels in Fibonacci pivot points diverge from the conventional methods.
- R1 = P + (.382 * (High (previous) – Low (previous)
- R2 = P + (.618 * (High (previous) – Low (previous)
- R3 = P + (1 * (High (previous) – Low (previous)
- S1 = P – (.382 * (High (previous) – Low (previous)
- S2 = P – (.618 * (High (previous) – Low (previous)
- S3 = P – (1 * (High (previous) – Low (previous)
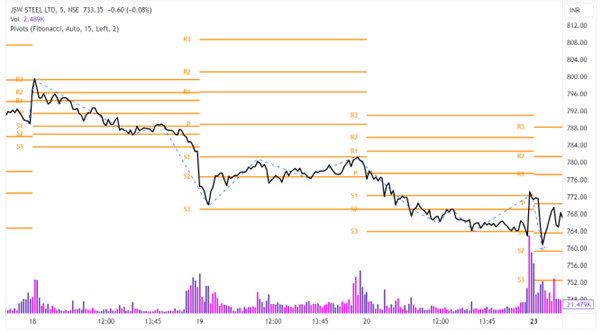
In the above chart of JSW Steel standard pivot points are plotted. The blue dotted line depicts the picture that how the price follows the resistances and supports provided by pivot point calculations. This easily helps traders to make decisions whether to long or short on security.
Demark Pivot Points
Demark pivot points diverge from the previously discussed pivot point variations as they specifically focus on the interplay between the opening and closing prices of security. In contrast to other pivot types, Demark pivot points provide a solitary level of support and a lone level of resistance. To compute these pivot points, a crucial determinant is the calculation of a variable referred to as “X.” This calculation leads to three distinct conditions, depending on the asset’s price dynamics.
- The closing price is less than the opening price: X = High + (2Low) + Close
- The closing price is more than the opening price: X = (2High) + Low + Close
- The closing price is the same as the opening price: X = High + Low + (2Close)
Once you have calculated the X, it’s possible to find P, S1, and R1.
- P = X/4
- S1 = X/2 – High
- R2 = X/2 – Low
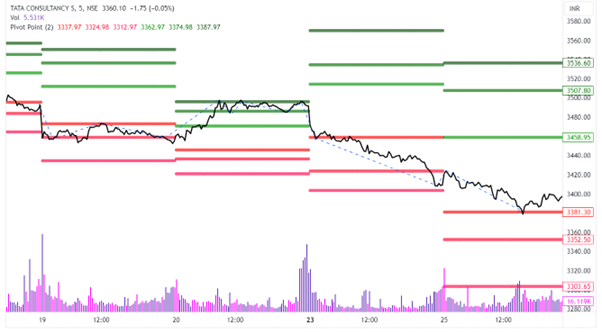
In the above chart of TCS standard pivot points are plotted. The blue dotted line clearly depicts the picture that how price follows the resistances and supports provided by pivot point calculations. This easily helps traders to make decisions whether to long or short on security.
Read: Intraday Trading – Mastering the Art of Maximum Profits
Relevance of Pivot Points
- Support and Resistance: Pivot points help identify significant support and resistance levels. These levels act as barriers that prices tend to react to. Traders use pivot points to make informed decisions about entry and exit points. When prices approach a pivot point, it often indicates a potential reversal or continuation of the trend, making them valuable reference points.
- Price Reversals and Breakouts: Pivot points serve as reliable indicators for price reversals and breakouts. Traders observe how prices interact with pivot levels to determine the likelihood of a reversal or a breakout. A breach of a pivot point suggests a potential trend continuation, while a bounce from a pivot level could signal a reversal.
- Decision Making: Pivot points assist traders in making timely decisions. By providing clear reference points, they aid in setting stop-loss orders and profit targets. Traders can use pivot points to establish trading strategies, making decisions based on the price’s relationship with these levels.
- Risk Management: Pivot points are invaluable for risk management. They help traders determine the optimal placement of stop-loss orders, reducing potential losses. Additionally, pivot points aid in position sizing, as they provide insights into the market’s volatility and potential price movements.
Disclaimer: This blog has been written exclusively for educational purposes. The securities mentioned are only examples and not recommendations. It is based on several secondary sources on the internet and is subject to changes. Please consult an expert before making related decisions.

