The Market Mood Index (MMI) is a quantitative sentiment indicator that gauges the overall sentiment of market participants towards the financial markets. It was developed by MarketPsych, a US-based quantitative behavioural finance research company. The MMI is calculated using a proprietary algorithm that incorporates various sources of data, including news sentiment, social media sentiment, and trading activity. The index ranges from 0 to 100, with 0 representing extreme fear and 100 representing extreme greed.
Example
Assume a stock is performing exceptionally well, with its price increasing from Rs 500 to Rs 1,000 during a bull market. It is an opportunity to earn some profit
So, you invest Rs 10,000 for ten stocks. However, the stock’s fall had already begun. However, you continue to hold it, believing that it will rise as well, and it continues to plummet. You decide to sell it at Rs 600 per share out of fear. This means that the share is worth a total of Rs 600. So, to summarise, if you invest in a bullish market, you will lose Rs 400 a share. You have suffered this loss because you did not know when to invest in a stock. You chose to invest your money at an inopportune time.
Types of Market Moods
- Extreme fear (0-30): This is when investors are panicking and selling their stocks at any price. This is often caused by a sudden and unexpected event, such as a market crash or a terrorist attack. A high level of extreme fear (less than 30) indicates that now is a good time to open new positions. As a result, markets are likely to be oversold and may start to rise.
- Fear (30 to 50): This is when investors are concerned about the future of the market, but they are not yet willing to sell their stocks. They may be holding off on buying new stocks, but they are not yet panicking. The range of fear is (30—50), which implies that investors are anxious about the market, but the best line of action is dependent on the direction of the MMI. When it falls from Greed to Fear, it indicates that the market is growing more scared. Additionally, investors should wait until the market reaches Extreme Fear to see if it will begin to rise. MMI produced from acute fear suggests that market fear is declining. If not the ideal time to invest in the market, today can be a good time to do so.
- Greed (50 – 70): This is when investors are feeling confident about the future of the market and are buying stocks at high prices. This can be a dangerous time to invest, as stocks are often overpriced and could fall sharply if there is a correction. If MMI falls from Extreme Greed, it indicates that greed in the market is decreasing. However, greater patience is advised before seeking out new chances.
- Extreme greed (70 – 100): This is when investors are irrational and buy stocks at any price, regardless of the risks. This is often the top of a market bubble, and stocks are likely to fall sharply soon after. High extreme greed (>80) indicates that investors should avoid initiating new positions since markets are overbought and likely to fall.
How the Market Mood Index is Calculated
To calculate the market mood index score, six main ingredients must be compared and analysed. Here’s a closer look at them:
FII Activity: FII, or Foreign Institutional Investor, activity refers to the buying and selling of Indian stocks by foreign investors. FIIs can be institutions such as pension funds, mutual funds, hedge funds, and sovereign wealth funds.
FII activity can have a significant impact on the Indian stock market. When FIIs are buying Indian stocks, it can drive up stock prices. Conversely, when FIIs are selling Indian stocks, it can drive down stock prices
The Market Mood Index measures the net open interest in Index Futures on the NSE by FIIs. A higher average value of the same indicates that FIIs are positive in the markets.
Market Breadth: Market breadth is a measure of how widely price movements in a market are distributed. A broad market means many stocks are moving in the same direction, while a narrow market means only a few stocks are driving the move. The Modified Arms Index (MAI) is a technical indicator that measures market breadth. It is calculated by dividing the Advance/Decline (A/D) ratio by the Advance/Decline Volume (AD Volume) ratio.
Price swings occur in the market all the time, but when they are accompanied by high trading volume, it indicates that the trend is more real and likely to persist. The Modified Arms Index measures this, supporting the market’s strength as projected by other MMI indicators.
Volatility Skew: Volatility and skew are often used together to analyze the market’s expectations for the future price of an underlying asset. For example, an option with a high implied volatility and a positive skew suggests that the market is expecting a large move in the underlying asset’s price, with more downside risk than upside risk.
Know: Mastering Volatility In Stock Trading
A higher average skew value indicates a larger likelihood of a downward trend. As a result, when the average value of skew is greater, the Market Mood Index is more likely to enter the fear zone.
Price Strength: Price strength is a momentum indicator that indicates how strongly the market is moving towards a bullish or negative trend.
Price strength is a momentum indicator that indicates whether the market is entering a bullish or negative phase. When combined with other indications in the MMI, it can assist in determining whether the market is in a state of greed or fear.
Momentum: Momentum in the stock market refers to the rate of change of a stock’s price. It is a measure of how quickly the price is moving in one direction or the other.
Positive momentum is shown by a positive exponential moving average. This indicates that the market is in an uptrend, and hence the Market Mood Index will shift to the greed zones.
A negative exponential moving average, which indicates negative market momentum, will send MMI into the fear zones.
Gold Demand
To assess gold demand, the price return of gold over the last two weeks is compared to the return of the Nifty over the same time period. If gold’s return increases relative to the Nifty, it implies that investors are shifting away from equities and towards safer assets such as gold. And the other way around.
Increased demand for gold indicates that investors are moving away from equities. The Market Mood Index (MMI) would then enter the fear zone. Lower demand for gold, on the other hand, would drive investors to equities, pushing MMI into the greed zone.
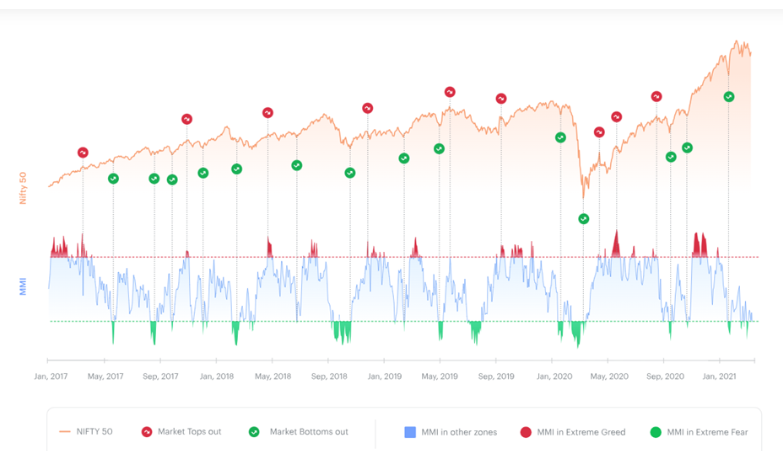
Snapshot of MMI