


Introduction
In the world of stock trading, the old saying “money follows movement” holds true. Stock prices constantly move, but the pace of these movements can vary. Sometimes, the market remains calm, while at other times, prices soar or plummet rapidly. This concept of how quickly prices change is known as volatility, or simply, the speed of price movements.
Volatility: The Two Sides
Volatility has two sides to it. On one hand, it presents an opportunity for traders to make more money, but on the other, it increases the level of risk. To navigate this challenge, traders use indicators to assess the current volatility of a stock. In this blog, we’ll focus on one such indicator: the Average True Range (ATR).
Understanding Average True Range (ATR)
The Average True Range, or ATR, is a volatility-based technical indicator introduced by J. Welles Wilder in 1974. ATR helps active traders gauge how much an asset typically moves over a specified time frame.
ATR as a Volatility Indicator:
ATR doesn’t provide buy or sell signals. Instead, it’s a tool used alongside a trading strategy to filter trades. It doesn’t predict market movements but helps determine the stock’s volatility. When ATR is falling, it suggests decreasing volatility, while a rising ATR indicates increasing volatility.
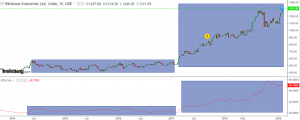
In the chart below, it’s evident that the bottom displays the ATR (Average True Range), while the top illustrates the price movement of ‘Reliance Industries’ stock. When ATR was moving slowly, it indicated a consolidation or range-bound trading pattern. However, after February 2017, ATR began to expand, suggesting that the stock is likely to gain trending momentum.
Using ATR for Stock Selection:
Volatility is cyclical, shifting from low to high and back again. When the market experiences low volatility, it often precedes a period of higher volatility. Traders can use this concept to identify potential breakout trades before they happen.
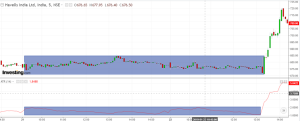
For instance, in the intraday chart of Havells India Ltd. shown above, the stock traded in a narrow range for two days, and ATR reached a recent low. This compression in volatility was followed by an explosive breakout in the stock’s price.
ATR for Profit Booking
Profit booking is a critical aspect of short-term trading. Knowing when to exit a trade can make or break your profitability. ATR acts like a fuel gauge in a car, indicating how much fuel (profit potential) remains in your trade. It provides an estimate of how far the price is likely to move based on recent price movements.
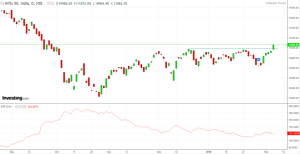
For example, if you had entered a trade on February 6, 2019, with Nifty, and it broke out at 10,980, you could use ATR to calculate an upside target for the day. By adding ATR (14) to the low of that day, you would get the expected target. In this case, it was 11,085.55, and Nifty reached a high of 11,072, closely aligning with the ATR target.
ATR as a Volatility-Based Stop Loss:
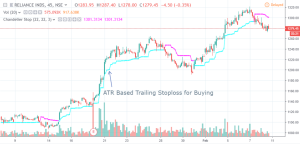
Setting stop losses based on support levels alone may not account for the speed of volatility. ATR offers a solution for this. You can calculate your stop loss by considering the average volatility. Common multipliers for stop losses are 2 for aggressive trades and 3 for conservative ones. If you’re in a long trade and the price moves in your favour, using “High – (2 * ATR)” as your trailing stop loss can help you secure gains without exiting prematurely.
Read: Mastering the Art of Timing in Intraday Trading
Conclusion:
Understanding and harnessing volatility is a crucial skill in stock trading. ATR serves as a valuable tool for traders by helping them assess volatility, identify potential breakout trades, make informed decisions about profit booking, and set effective stop losses. By integrating ATR into their trading strategies, traders can navigate the ever-changing landscape of the stock market with greater confidence and precision.
Disclaimer: This blog has been written exclusively for educational purposes. The securities mentioned are only examples and not recommendations. It is based on several secondary sources on the internet and is subject to changes. Please consult an expert before making related decisions.

