


The Supertrend Indicator is a technical analysis tool designed to identify market trends and potential entry and exit points in trading. Developed by Olivier Seban, it is a versatile indicator that can be applied to various markets, including stocks, futures, forex, and commodities. The indicator’s primary function is to filter short-term price fluctuations and capture the underlying trend direction.
The Supertrend Indicator is a powerful technical analysis tool that can help traders identify market trends, manage risk, and confirm market tendencies. It is particularly effective in markets with high volatility. However, it is important to wait for a confirmed signal before taking a trade, as false signals can occur during these periods. The Supertrend Indicator is a valuable tool for traders of all skill levels, and it can be used in conjunction with other trading tools and techniques.
Calculation of the Supertrend Indicator
The Supertrend Indicator is calculated using two parameters: period and multiplier. The period determines the number of periods used in the calculations, while the multiplier determines the sensitivity to price fluctuations. The indicator’s value is calculated based on the following formula:
Supertrend = Basic Upper Band – Factor * ATR
where:
Basic Upper Band = (Highest High + Lowest Low) / 2 + Factor * ATR
Factor = Multiplier used to adjust sensitivity
ATR (Average True Range) = Measure of volatility
Interpretation of the Supertrend Indicator
There is no need to calculate Supertrend values, broker platform or free technical chart websites provide the indicator named Supertrend.
How to Interpret Supertrend
The Supertrend Indicator is plotted as a line on the price chart. When the price is above the Supertrend line, it indicates a bullish trend, suggesting that traders may consider entering long positions. Conversely, when the price is below the Supertrend line, it suggests a bearish trend, indicating that traders may consider entering short positions.
Trading Strategy with Supertrend
Strategy 1: Supertrend and Price
The Supertrend Indicator can be used to generate buy and sell signals by identifying crossovers between the price and the Supertrend line. A buy signal is generated when the price crosses above the Supertrend line, while a sell signal is generated when the price crosses below the Supertrend line.
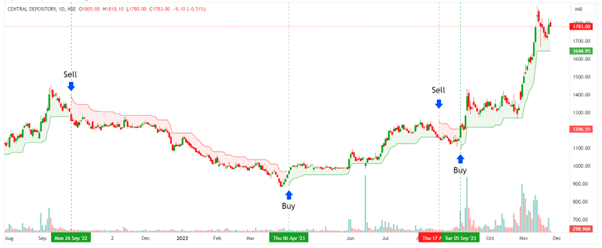
The above chart of CDSL reflects the Supertrend trading strategy. The settings used for the supertrend are changed, where an ATR of 21 is used and the factor is kept at 3.
Moving towards the strategy, as the trend is our friend, Supertrend helps us to understand and trade accordingly. On September 26, 2023, the stock price crossed a supertrend and was given a sell signal to initiate a short trade, suggesting the price is going to follow a downtrend now. After that, the CDSL stock saw a huge downtrend until the next buy signal popped up. On April 6, 2023, the stock price crossed a supertrend, was given a buy signal, and followed a good uptrend to go long on trade. On August 17, 2023, the stock price generated a sell signal, but the trend never sustained, and again the buy signal appeared. Until now, the stock has been in an uptrend.
Strategy 2: Supertrend and Moving Averages
For avoiding consolidation ranges trading, this is the ideal EMA crossover. The Super Trend and 20-50 EMA crossover are the two main components of this strategy. A buy signal is generated when the Super Trend turns green, meaning it is below the price, and the 20 EMA is above the 50 EMA. Similar to this, a sell signal is produced when the Super Trend turns red, meaning it is above the price, and the 50 EMA is above the 20 EMA.
Read: What is Exponential Moving Average (EMA)
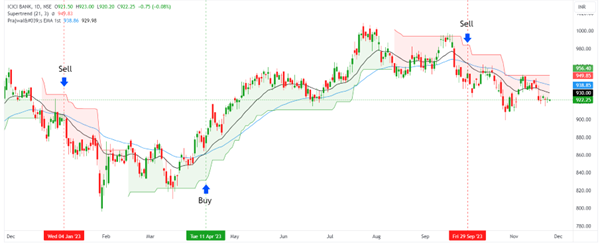
The above chart of ICICI Bank reflects the supertrend trading strategy. The settings used for the supertrend are changed, where an ATR of 21 is used and the factor is kept at 3.
Diving into the strategy as suggested on January 4, 2023, the 20 EMA crossed the 50 EMA, and the trend suggested by the supertrend was bearish, so here we got out of the sell side trade. After that, on April 11, 2023, the 20 EMA crossed up above the 50 EMA, and the supertrend was bullish, so we got the buy signal for riding the uptrend. On September 29, 2023, the setup again generated a sell signal at 20 EMA, crossing down to 50 EMA, and the supertrend was bearish. If observed clearly, this setup has avoided the consolidation before the start of the trend, and we have a clear uptrend to ride without any whipsaws. Stoploss can be trailed with a super trendline.
Limitations of the Supertrend Indicator
Like any technical indicator, the Supertrend Indicator is not foolproof and can generate false signals. It is important to note that the Supertrend Indicator is a lagging indicator, meaning it reacts to price changes after they have occurred. This can lead to instances where the indicator generates a signal after a significant price move has already taken place.

