


In the world of trading, there’s a famous quote that consistently reverberates among traders, from seasoned professionals to those just starting out: “To succeed in trading, you must have a strategy and trading setup, that is profitable.” This quote encapsulates the very essence of what it takes to navigate the tumultuous waters of financial markets. Let’s delve deeper into the realm of trading strategies, and explore one of the most remarkable and effective ones – the Bollinger Band Squeeze.
The Calm Before the Storm: Bollinger Band Squeeze
Before we dive into the intricacies of this strategy, let’s tip our hats to the brilliant mind behind it, John Bollinger. He introduced the world to Bollinger Bands in the early 1980s, which quickly became a cornerstone of technical analysis. Bollinger Bands consist of three key components: a middle band, representing a simple moving average (SMA), and upper and lower bands. The upper band is calculated as the SMA plus two standard deviations, while the lower band is the SMA minus two standard deviations.
At its core, the Bollinger Band Indicator serves as a measure of the volatility of closing prices. The bands expand when price volatility surges and contract when it subsides.
Read: Top Trendline Trading Secrets
Decoding the Bollinger Band Squeeze
Now, let’s unravel the mystery of the Bollinger Band Squeeze. Picture this scenario: The markets enter a phase of relative calm, characterised by minimal price fluctuations. During this phase, the Bollinger Upper and Lower bands draw closer together, forming what traders affectionately call a ‘Bollinger Band Squeeze.’ To put it simply, as price movements narrow, volatility contracts, causing the bands to squeeze in towards each other.
But what makes this setup so potent? Much like the sun shining brightly after a dark and stormy night, a period of low volatility often precedes a significant surge in volatility. This surge presents a golden opportunity for astute traders to profit, especially when they time their entry just right.
Practical Application: Bollinger Bands Squeeze
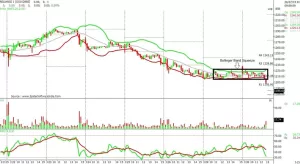
Now, let’s move from theory to practice by examining some real-world examples. Consider the recent case of the index heavyweight Reliance Industries, which underwent a noticeable contraction in volatility, leading to the formation of a Bollinger Band Squeeze setup (as depicted in Chart: 1).
Chart: 1 (Reliance Industries)
Next, take a look at what transpired after the Bollinger Band Squeeze (as shown in Chart: 2).
Chart: 2
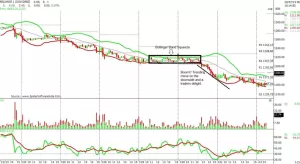
It’s evident that following a Bollinger Band Squeeze, the stock price embarked on a substantial downward movement. Such opportunities are a trader’s delight, as they provide a chance to ride a prominent trend.
In essence, this strategy simplifies the concept that a period of price contraction is often succeeded by a period of price expansion. This straightforward yet highly effective strategy can substantially elevate your trading game. Remember, in trading, simplicity is often the key to success, and there’s no need to let complexity obstruct your path to profitable trades.
While the Bollinger Bands Squeeze is a potent setup for capitalizing on market movements, it’s essential to note that it’s not a standalone trading system. By incorporating basic technical analysis and keeping a close eye on price action, we can enhance our odds of success. However, it’s vital to keep in mind that perfection remains elusive in the world of trading, and flexibility and adaptability are essential traits for traders seeking long-term success.

