


If you’re a trader, you’ve likely heard the age-old adage, “The trend is your friend.” It’s a fundamental principle in technical analysis that following a trend can be one of the most effective ways to grow your portfolio. However, no trend lasts forever, and there comes a time when the trend you’re trading will reverse, making way for a new one. Recognizing this pivotal moment is crucial for traders, as it presents both the need to exit an existing position before the reversal and the opportunity to enter a new trade early for greater potential gains.
In this blog, we’ll explore a technique that can help traders identify trend reversals with increased accuracy. This technique revolves around understanding the concepts of “higher highs” and “lower lows” in stock or security prices. Once these concepts are clear, we’ll delve into a longer-term pattern technique known as the “record session count,” which can serve as a valuable tool in your trading arsenal.
Higher Highs and Lower Lows: A Fundamental Concept
Before we dive into the reversal strategy, let’s ensure everyone is on the same page regarding higher highs and lower lows. These terms refer to price movements in a security or stock:
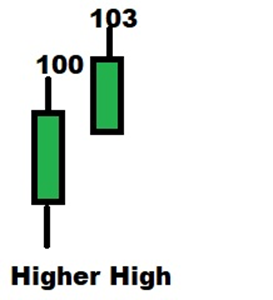
Higher High: Occurs when the current high price is greater than the previous high.
Lower Low: Occurs when the current low price is lower than the previous low.
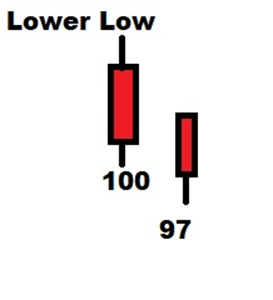
For example, in Figure 1, we can see a higher high as the high of the previous candle was 100, and the next candle reached 103. Conversely, in Figure 2, a lower low is evident as the low of the first candle is 100, and the low of the second candle is 97.
Now that we’ve clarified these concepts, let’s explore the “record session count” technique.
Record Session Count: Unveiling Trend Reversals
Most candle patterns typically consist of one, two, or three candles. However, the record session count technique unfolds over a longer period and is thus highly valuable for traders. This technique is based on identifying “record session highs” and “record session lows.”
- Record Session High: When a candle achieves a higher high, it is called a record session high.
- Record Session Low: When a candle reaches a lower low, it is termed a record session low.
The critical point to note is that when there are eight to ten consecutive record sessions (eight to ten higher highs or lower lows), it raises the likelihood that the current trend will change direction. The significance of the numbers eight and ten in this context is underscored by their description as “the bones of Sakata’s body” in Japanese trading philosophy. This expression likens these record sessions to the foundational structure of a person’s body, emphasizing their importance in analyzing market trends.
Read: Trendline Trading Secrets You Should Know
How to Count Record Session Highs: A Step-by-Step Guide
Let’s go through a step-by-step process to count record session highs and understand how they can signal a trend reversal:
- Confirm the Low: First, you need to confirm that a low price for the trend has occurred. This is typically observed just before the candle where we mark as “1.”
- Mark the Start: The candle marked as “1” exhibits a higher high, signalling the beginning of the count. Mark this candle as “1.”
- Continue Counting: Now, label subsequent candles as “2,” “3,” and so on as long as they continue to achieve higher highs. Aim for a sequence of 10 record session highs.
What Happens After a Record Session High Count of 10?


As seen in historical data, when a stock or security reaches a record session high count of 10, it often marks a turning point. The price tends to start declining, indicating a potential trend reversal. This information can be invaluable for traders looking to exit positions or potentially enter new ones in the opposite direction.
Applying the Same Principle to Record Session Lows
The same principle can be applied in reverse for record session lows. When there are eight to ten consecutive lower lows, it suggests that the market may be oversold and due for a reversal to the upside.
Final Considerations
Remember that this technique considers only higher highs and lower lows for record session counts, and the sessions should preferably be almost consecutive. While the concept of record sessions suggests overbought or oversold market conditions, a few days of consolidation can be overlooked. Additionally, keep an eye out for major reversal candlestick patterns, such as a Bearish Engulfing pattern after a record session high or a Bullish Engulfing pattern following a record session low, as these can provide further confirmation and relevance to your trading setups.
In conclusion, mastering the art of identifying trend reversals through record session counts and understanding the significance of higher highs and lower lows can greatly enhance your trading strategies. By staying attuned to these patterns, you’ll be better equipped to make informed decisions and potentially profit from market fluctuations.
Happy trading!
Disclaimer: This blog has been written exclusively for educational purposes. The securities mentioned are only examples and not recommendations. It is based on several secondary sources on the internet and is subject to changes. Please consult an expert before making related decisions.

