


Making wise trading decisions in the fast-paced world of financial markets requires a grasp of how price and volume interact. By gauging the movement of buying and selling pressure, the technical analysis indicator known as on-balance volume (OBV) seeks to clarify this link. OBV, which Joseph Granville created in 1963, has become well-known among traders for its capacity to recognize possible trend reversals and validate current trends.
What is On Balance Volume Indicator?
In order to determine the buying and selling pressure of a stock, the On-Balance Volume (OBV) indicator takes into account both price movement and trading volume. Depending on whether the stock price closed higher or lower than the close of the prior day, it adds or deducts the daily trading volume from a running total to achieve this. Following that, a chart is created using the stock price and this cumulative total.
To put it another way, the OBV indicator calculates how much the trading volume confirms or refutes the direction of the price. The stock may continue to rise if the OBV continues to rise, indicating that there is significant buying pressure behind the shares. On the other hand, a declining OBV suggests extreme selling pressure and may portend a reversal or downturn.
How to calculate On Balance Volume?
Positive and negative volume added together is what makes up the On Balance Volume (OBV) line. When the close of a period is higher than its previous close, its volume is positive; when it is lower, it is negative.
If the closing price is above the prior close price, then:
Current OBV = Previous OBV + Current Volume
If the closing price is below the prior close price, then:
Current OBV = Previous OBV – Current Volume
If the closing prices equals the prior close price, then:
Current OBV = Previous OBV (no change)
How to Interpret and Use On Balance Volume?
The OBV index is a technical indicator that measures the volume of buying and selling pressure in a stock. It is used to confirm price trends and identify potential reversals.
A rising OBV index confirms a rising price trend. This means that there is more buying pressure than selling pressure, and the stock is likely to continue to rise.
A falling OBV index confirms a falling price trend. This means that there is more selling pressure than buying pressure, and the stock is likely to continue to fall.
A divergence between the OBV index and the price trend suggests that a reversal is likely. This means that the volume is not supporting the price trend, and the trend may soon reverse.
In other words, the OBV index is a useful tool for identifying trends and reversals in stock prices. By observing the OBV index and its relationship to price action, investors can make more informed trading decisions.
Examples of On Balance Volume Trading or Short-tern Investing
Tata Consultancy Services Ltd
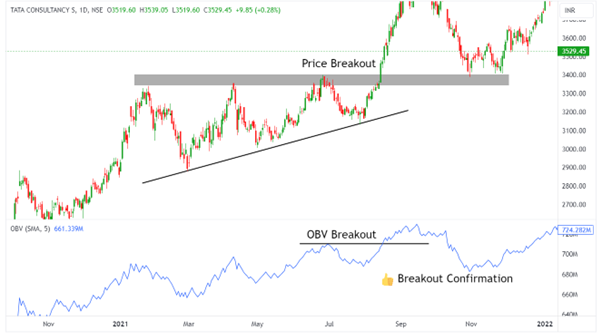
In the above-given chart of TCS, the defending triangle chart pattern is visible. After the breakout, we used On Balance Volume to confirm the breakout and the buying pressure to make an informed decision about going long on the TCS stock. As the breakout of price triggers, the OBV also breaks the prior highs, showing strong buying pressure on the stock.
Kotak Mahindra Bank Ltd
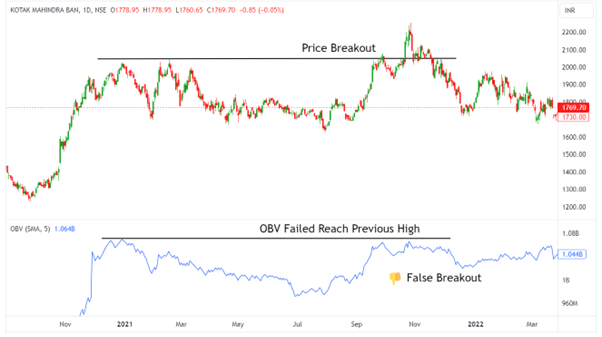
In the above daily chart of Kotak Mahindra Bank, the price broke out of the 52-week high but never sustained the breakout. The breakout was false, but the trader never knows because many times they believe the price is the real picture of the market. As we check for the buying pressure for validation of the breakout, we see that in the above chart, OBV failed to reach its prior high at the time of the breakout and never touched the same. It is doubtful that the price may not be backed by much buying pressure, but sellers are holding control and about to trap the buyers into dominating them.
Disclaimer: This blog has been written exclusively for educational purposes. The securities mentioned are only examples and not recommendations. It is based on several secondary sources on the internet and is subject to changes. Please consult an expert before making related decisions.

