


In the world of technical analysis, traders and investors often turn to a variety of indicators and signals to make informed decisions about buying and selling assets, particularly in the financial markets. The “Golden Cross” is one such signal that has gained popularity for its potential to identify trends and signal opportunities in the stock, forex, and cryptocurrency markets.
Understanding the Golden Cross
The Golden Cross is a technical analysis pattern that occurs when a relatively short-term moving average (usually the 50-day) crosses above a long-term moving average (typically the 200-day). It is considered a bullish signal, suggesting that a stock or asset’s price is likely to continue rising. This signal is named “Golden” because it implies a positive outlook for the asset’s price movement.

Three Stages of Golden Crossover
Stage 1: Transition from Downtrend to Uptrend
The Golden Cross begins with the first stage, where a downtrend reaches a turning point. Buyers start to dominate the market, overpowering the sellers.
Stage 2: Crossover and Trend Reversal Confirmation
In the second stage, a pivotal moment occurs when the shorter moving average crosses over the larger moving average. This crossover signals a breakout and confirms the reversal from a downward trend to an upward one.
Stage 3: Sustained Uptrend
The final stage witnesses a continuing uptrend following the crossover. The two moving averages serve as support levels during pullbacks, maintaining the bullish trend until a potential reversal is indicated by a subsequent crossover when the shorter moving average crosses back down.
Crucial Support and Resistance
Following the crossover, the long-term moving average plays a significant role as a major support level in the Golden Cross. These crosses indicate potential trend changes but typically appear after a shift in the trend has already taken place.

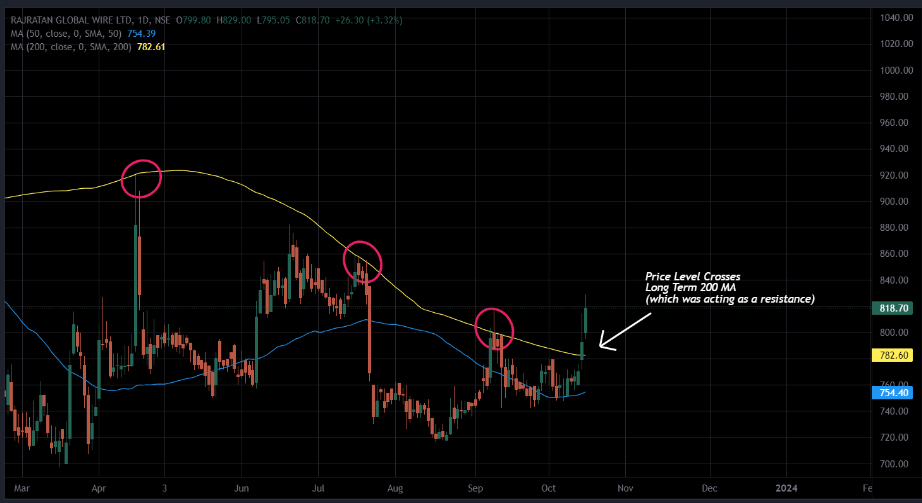
Resistance Levels are marked by a red circle.
Trend reversal confirmation (only if 50MA crosses above 200MA )
Before the Golden Cross happens, the 200-day MA can act as a resistance level. This is because the 200-day MA represents a longer-term average of the stock’s price, and when the stock price is below the 200-day MA, it implies that the longer-term trend may be bearish. As the stock price approaches the 200-day MA, it often encounters resistance, which means there may be selling pressure as it nears this level.
Read: Death Crossover Trading Strategies
The Golden Cross, which occurs when the 50-day MA crosses above the 200-day MA, is seen as a bullish reversal signal. It indicates that the shorter-term trend is now stronger than the longer-term trend. Once the Golden Cross is confirmed, the 200-day MA often transforms from a resistance level into a support level, as it signifies a shift towards a bullish trend.
Reliability of Golden Cross Indicators
The Golden Cross serves as a lagging indicator, meaning it becomes apparent only after the market has already experienced an uptrend, which lends it an appearance of reliability. However, its inherent lag makes it challenging to distinguish false signals until after the fact. Consequently, traders often use the Golden Cross in combination with additional indicators to validate trends or signals.
Conclusion
The Golden Cross is typically used to confirm the reversal of a downward trend. To maximize its effectiveness, it’s essential to complement it with supplementary filters and indicators. Additionally, the wise use of profit targets, stop-loss orders, and other risk management tools is crucial. Remember to maintain a favourable risk-to-reward ratio and execute trades with precise timing, rather than mechanically following the Golden Cross.
Disclaimer: This blog has been written exclusively for educational purposes. The securities mentioned are only examples and not recommendations. It is based on several secondary sources on the internet and is subject to changes. Please consult an expert before making related decisions.

