


In the exhilarating world of trading, patterns often hold the key to unlocking profitable opportunities. One such pattern that commands attention is the intriguing “Double Top.” It’s a pattern that traders watch closely, for it carries the potential for substantial profits when deciphered correctly. In this blog, we’ll dive deep into the fascinating realm of Double Tops, unraveling its mysteries, learning how to identify it, trade it, and exploring its advantages and disadvantages.
Understanding the Double Top Pattern
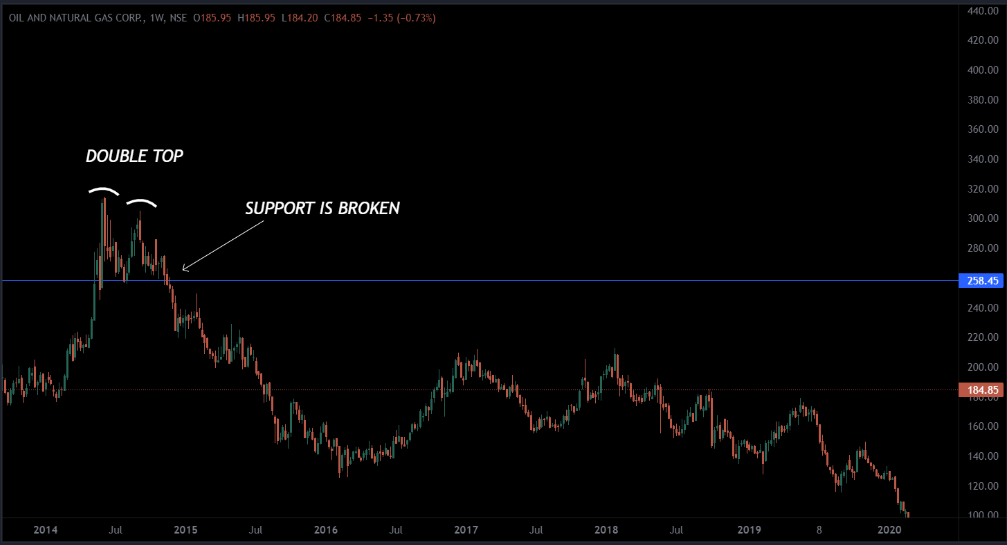
A double-top pattern is a technical analysis chart pattern that is often considered a bearish reversal pattern. It typically forms after an extended uptrend and is characterized by two distinct peaks at roughly the same price level, with a trough in between.
This pattern is a harbinger of a trend reversal following an uptrend. It’s characterized by two peaks of almost identical height, separated by a trough. These peaks signal that the price has tested a resistance level twice but failed to break through. Traders often interpret this pattern as a signal to sell or initiate short positions, anticipating further market declines.
Identifying a Double Top: Step by Step
Recognizing a Double Top may seem complex, as no two instances are exactly alike, and false signals can mislead traders. However, there are general steps to identify this pattern:
- Spot the Uptrend: The asset should exhibit a clear uptrend before the Double Top formation. This means that the price has been consistently making higher highs and higher lows.
- Locate the First Peak: Identify the first peak of the uptrend, which marks the highest point before the price starts to descend.
- Find the Trough: Following the initial peak, the price briefly drops, forming a valley or trough.
- Discover the Second Peak: The price rallies again, attempting to establish a new high. However, this second peak falls short of the first peak’s height and begins to decline again.
- Verify the Pattern: To confirm a Double Top pattern, ensure that the decline following the second peak is lower than the trough following the first peak. This indicates that the prior resistance level wasn’t breached successfully.
- Draw the Neckline: Connect the low points of the two troughs with a horizontal line. This line, known as the neckline, serves as a crucial reference point for the pattern.
- Confirm the Double Top Pattern: Watch for a price break below the neckline to verify the pattern. A break below the neckline is often considered a sell signal, signifying a potential trend reversal.
Know: Trendline Trading – Top Secrets You Should Know
Advantages and Disadvantages of a Double Top
Advantages:
- The Double Top pattern provides a clear visual cue of a potential trend reversal from an uptrend to a downtrend. Traders can capitalize on this shift and explore fresh profit opportunities.
- The pattern often forms a distinct resistance level with two consecutive peaks at nearly the same price. This level can serve as a reference point for setting stop-loss orders, and profit targets, and improving risk management.
- The break of the neckline offers a well-defined entry point for traders to initiate short positions. If the price fails to break below the neckline, it provides a clear level for market entry and aids in pattern invalidation.
- Volume analysis can add an extra layer of confirmation to the pattern. Increased volume during the neckline breakout and decreased volume during the pattern’s formation can enhance the pattern’s reliability.
- The pattern typically offers a good risk-reward ratio, with potential profit targets often exceeding the initial risk (stop-loss).
Disadvantages:
- Double Top patterns are not foolproof. Like any chart pattern, they can occasionally produce false signals, especially if the price briefly forms two peaks before continuing its upward trajectory. It’s crucial to await confirmation, such as a neckline breach.
- There can be some subjectivity in recognizing a Double Top. Traders may interpret the position of peaks and troughs differently, leading to variations in outcomes.
- Double Top patterns may lack precise symmetry. This variability in pricing ranges, time duration, and pattern shape can make it challenging to pinpoint entry and exit levels or set target levels.
- The downside target for a Double Top is typically calculated by extending the pattern’s height from the neckline. However, the potential profit target can be constrained relative to the starting risk or stop-loss level, as the price doesn’t always reach the projected target.

