


")
In technical analysis, the Exponential Moving Average (EMA) channel stands as a versatile tool employed by traders to identify potential trend continuations, reversals, and support and resistance levels. By plotting two or more EMAs of varying lengths, a channel is formed, encompassing price movements and providing valuable insights into market dynamics. The EMA channel’s effectiveness stems from its ability to smooth out price fluctuations and highlight underlying trends, making it a valuable addition to any trader’s toolkit.
The EMA channel is a versatile tool that can be used in trading across various timeframes, from short-term to long-term. It is applicable to a wide range of financial instruments, including stocks, bonds, currencies, and commodities. This makes it a valuable tool for technical analysis, allowing traders to identify trends, potential breakouts, and support and resistance levels. The EMA channel can be used in conjunction with other technical indicators to refine trading strategies and enhance decision-making.
Calculation of EMA
An exponential moving average (EMA) is a type of moving average that places a greater weight on recent prices than on older prices. This is done by using a weighting factor that decreases exponentially with the age of the price.
The formula for calculating an EMA is as follows:
EMA = (Close – Previous EMA) * Multiplier + Previous EMA
Where:
- Close is the closing price of the security for the current day
- Previous EMA is the EMA for the previous day
- Multiplier is a weighting factor that decreases exponentially with the age of the price
The multiplier is calculated as follows:
Multiplier = 2 / (Time Period + 1)
Where:
- Time Period is the number of periods that the EMA is being calculated over
It is advised to use readymade EMA indicators already available at the brokers platform or technical analysis charting website or software.
Creating the Setup
For creating an EMA channel, we are using 2 EMAs and a third one as a normal longer-term EMA.
- Plot 1st EMA over the chart with a 50-day period and use high values rather than the close.
- Plot 2nd Ema over the chart with a 50-day period and use low values rather than the close.
This created an EMA channel which will be used as a decision-making tool for trading.
- Plot 3rd EMA over the char with a 200-day period using close values which will be our traditional long-term trend checking indicator.
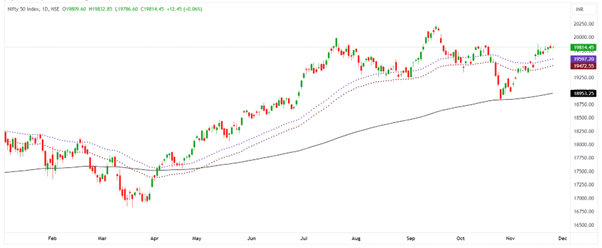
This is what the setup looks like.
Trading with EMA channel
The EMA channels we are using are non-crossing lines, providing a different approach to interpretation. The traditional 200-day EMA serves as a long-term trend detector, while the EMA channel generates buy and sell signals. When the price breaks above the upper EMA, it is considered a breakout of the EMA channel, and the candle can be treated as a breakout candle. The stop-loss should be set at the lower EMA line. For an upside breakout, it is crucial that the EMA channel lie above the 200-day EMA. Conversely, for breakdowns, the EMA channel must be below the 200-day EMA.
The above could be used for sell-side trades. When the price breaks the lower EMA, it is considered a breakdown of the EMA channel, and the candle can be treated as a breakout candle. The stop-loss should be set at the upper EMA line.
It is recommended to trade on the side of the trend. In the case of a strong breakout on the opposite side of the trend, the 200-day EMA could serve as a target for the trade. For trending side trades, the upside potential is open-ended.
One should set the target as per the individual risk-reward ratio. Fibonacci levels can be used to determine the potential targets.
Read: What is Exponential Moving Average (EMA)
EMA Channel Trading Examples
Nifty 50 day chart with EMA Chanel Setup
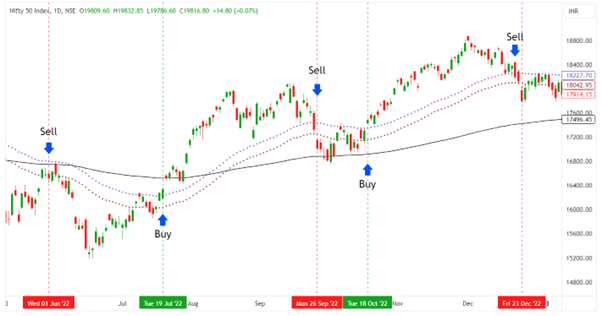
The above chart of the Nifty 50 shows the EMA channel trading scenario, where the EMA channel is plotted with a 200-day EMA. The buy and sell signals are clearly marked on the chart. As suggested in the trading strategy, on June 1st, 2022, the index price broke the lower EMA to activate a sell trade, with a stop loss placed at the upper EMA on a closing basis.
Then the trend continued for a few trading sessions. One should set the target as per the individual risk-reward ratio. Fibonacci levels can be used to determine the potential targets. On July 19, 2022, the price breakouts the upper EMA, where a 200-day EMA upside may act as resistance. Traders must watch cautiously in such situations. As the buyers were in control, it was a successful breakout.
The same scenario was observed for the sell trade on September 26, 2022, where a 200-day EMA acted as support for the price. On October 18, 2022, the Nifty 50 gave a breakout on the upper side, logging huge gains. Lastly, on December 23, 2022, a price breakdown was seen with a 200-day EMA on the down side.
Limitations
Like any technical analysis setup, this technical analysis setup is not foolproof and can generate false signals. It is important to note that the EMA channel is a lagging indicator, meaning it reacts to price changes after they have occurred. This can lead to instances where the indicator generates a signal after a significant price move has already taken place.

