


Buying a life insurance policy is a wise decision. But have you ever considered investing in life insurance companies by purchasing their stocks? Before acquiring any company’s stocks, it’s essential to comprehend the company’s business model and the process for assessing its performance, both independently and in comparison, to its peers.
When it comes to investing in life insurance companies, there is an apparent risk associated with these businesses due to their long-term nature and the high initial acquisition costs involved. Consequently, relying solely on a financial statement that provides the current year’s realised income with the entire acquisition cost charged upfront may offer an incomplete picture of value creation and profitability.
To make informed investment decisions in the life insurance sector, it’s essential to consider various key financial parameters. In this article, we will delve into these metrics to help you better understand how to analyse life insurance companies before making an investment.
Embedded Value (EV)
Embedded Value serves as a vital metric in assessing the worth of a life insurance company. It reflects the expected profitability from current underwritten policies and the company’s net worth. EV is calculated as the sum of the adjusted net worth (ANW) and the discounted value of profits from in-force policies (VIF). Consistent growth in Embedded Value indicates stability and is a positive sign for potential investors.
Value of New Business (VNB)
The Value of New Business measures the profitability of new business written in a given period. It represents the present value of all future profits to shareholders at the time of writing new business contracts. Understanding VNB is crucial for gauging fair valuations and assessing an insurer’s earnings potential.
Value of New Business (VNB) Margin
The VNB Margin is a paramount metric for shareholders. It provides insights into the profit margin of a life insurance company. To calculate the VNB margin, divide the Value of New Business by the Annualized Premium Equivalent (Regular Premium + 10% of Single Premium). A higher VNB margin indicates better profitability. Insurers often achieve higher VNB margins from their protection business, which is important for boosting overall profitability.
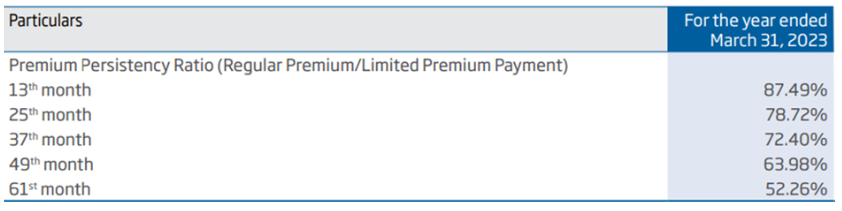
Persistency Ratio
The Persistency Ratio measures how long customers persist with their insurance policies. It is a vital metric as persistency significantly influences the profitability of an insurer. Comparing a company’s persistency ratios to global benchmarks is essential. The longer policyholders retain their policies, the more profitable it is for the insurer. For instance, if a company’s 61-month persistency ratio is 50%, it means that half of its customers are not paying premiums after five years.
Solvency Ratio
The Solvency Ratio is a key indicator of an insurance company’s financial health based on defined solvency norms. According to the Insurance Regulatory and Development Authority of India (IRDAI) guidelines, companies are required to maintain a solvency ratio of at least 150% to minimize bankruptcy risk. This ratio is calculated by comparing the available solvency margin (ASM) to the required solvency margin (RSM). A healthy solvency ratio demonstrates the company’s capacity to meet its short-term and long-term liabilities, assuring investors that claims can be settled even in extreme situations.
| Company | CMP Rs | EV Rs in Cr | VNB Rs in Cr | VNB Margin | Persistency Ratio (61 Month) | Solvency Ratio |
| Life Insurance Corporation of India | 605 | 5,82,243 | 9,156 | 16.20% | 62.00% | 187% |
| HDFC Life Insurance | 606 | 39,527 | 3,674 | 27.60% | 52.26% | 203% |
| SBI Life Insurance | 1,307 | 4,604 | 507 | 30.01% | 55.60% | 215% |
| ICICI Prudential Life Insurance | 512 | 3,563 | 277 | 32.00% | 65.80% | 209% |
Incorporating all the above metrics is crucial when evaluating the fundamentals of a life insurance company. To make well-informed investment decisions, it’s advisable to compare these metrics with those of the company’s peers, allowing you to assess its relative performance within the industry.
It’s worth noting that insurance penetration in India remains low, indicating significant potential for multi-year growth. Additionally, the ongoing digitization of the insurance industry offers opportunities for life insurance companies to expand their business. As an investor, you should not overlook the softer factors, such as the company’s brand image, as these also play a role in determining valuations. A strong and trusted brand can contribute to a company’s long-term success.
Also Fead: Guide to choosing the right motor insurance
Conclusion
Before investing in a life insurance company, it’s essential to consider a range of financial metrics and industry trends. By thoroughly assessing these factors, you can make more informed decisions and potentially tap into the growth opportunities within the Indian insurance market.

