


Bank Nifty has changed the day for its weekly index options from Thursday to Wednesday starting in September. This change applies to all types of options (weekly, monthly, and quarterly expiries). In this article, we’ll share insights on trading options on the new weekly expiry day and how you can use the Average True Range (ATR) indicator to better understand Bank Nifty’s potential moves.
What is ATR?
ATR stands for Average True Range, and it measures volatility. It was developed by J. Welles Wilder and is used to predict the extent of price movements in a security. ATR is calculated by finding the greatest value among three options:
- The difference between the day’s highest and lowest prices.
- The difference between the day’s highest price and the previous day’s closing price.
- The difference between the day’s lowest price and the previous day’s closing price.
Decoding Strategy
The most commonly used ATR variant is ATR-14, which calculates the average true range over the last 14 days. However, you can adjust this period based on your preferences, such as using 5 days or 10 days. In this article, we’ll use the 5-day ATR to estimate how much the Bank Nifty index might move on the day of expiry.
Example of Strategy
For example, on September 5th, the 5-day ATR was 497 points. To be cautious, we add a 10% buffer to this value, which is roughly 50 points. With a closing price of 44,532 on September 5th, we estimate that Bank Nifty might move around 550 points in either direction on the expiry day. This suggests it could reach 45,050 on the upside or 43,950 on the downside as marked in the chart and on September 6th the index remained traded within the range which was derived from ATR value. Traders should identify key support and resistance levels within this range for better decision-making, especially option writers.
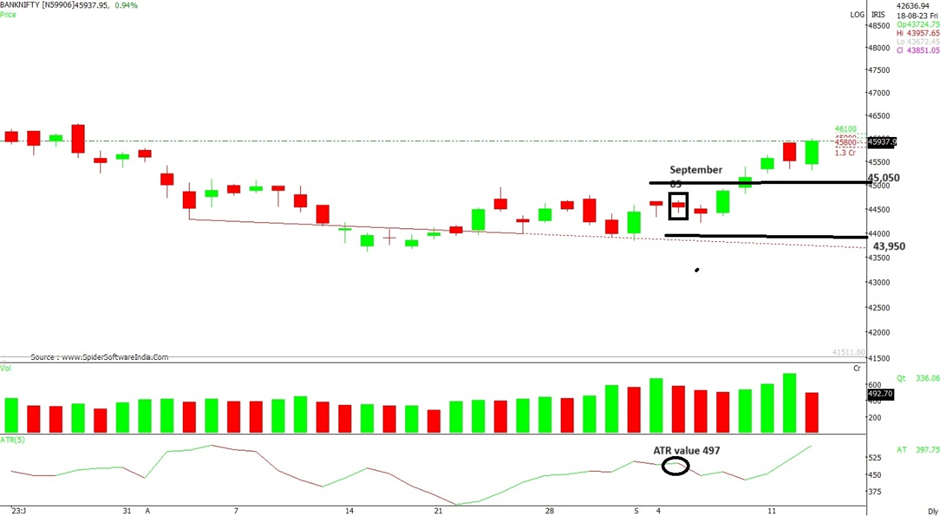
It’s important to note that while ATR provides insights into potential price range, it doesn’t predict the direction of price movement. Additionally, if volatility increases significantly, the actual price movement may surpass the ATR’s suggested limits.
Read: An Introduction to Call and Put Options
Although ATR doesn’t offer directional predictions, it does indicate the strength of the current trend. A rising ATR during a rally suggests a strong uptrend, and vice versa. However, ATR cannot keep increasing indefinitely. Analysing historical ATR levels can help determine whether the index is approaching a peak or bottom.

