


Market breadth is a leading indicator for the market to predict its next move, whether the price is misleading or true. The index is moving up with strong momentum, seeming that the trend is strong. However, at the back, only three constituents of that index are pushing it into the green. Let’s say if the Nifty Next 50 is up 1.5% today, it may look good, but actually, a few stocks of Adani rose more than 3%, pulling the index up while other stocks declined. This incorrect picture reflected by the price may turn into a loss for investment and decision-making. We understand that only the price does not depict the real picture.
Market breadth indicators are technical studies that measure the strength of a market trend by comparing the number of advancing securities to the number declining. Negative market breadth occurs when more stocks are declining than advancing, even if the overall index is up. Positive market breadth occurs when more stocks are advancing than declining, even if the overall index is down. Some market breadth indicators also incorporate volume because price changes accompanied by increased volume are more significant.
A market rally is considered more sustainable when it is accompanied by broad market breadth, meaning that a large number of stocks are participating in the rally. Conversely, a market rally with narrowing breadth, where only a select few stocks are driving the gains, is seen as a sign of weakening conviction and may be less sustainable.
By examining the provided chart, we can observe the Advance-Decline (AD) line displayed on a 1-day chart of the Nifty 50.
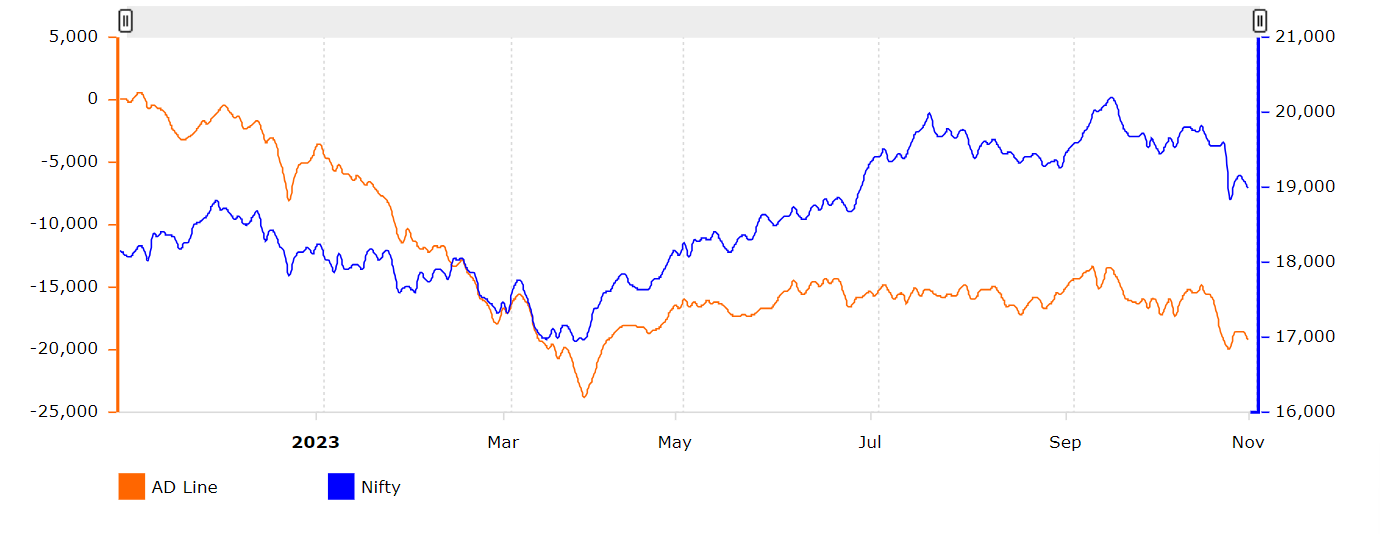
When you analyse the AD line on a chart, your aim is to identify divergence as a potential indicator of upcoming trend reversals. In the context of an uptrend in an index, if the AD line is declining, it suggests that the current price movement is likely to lose its upward momentum in the near future.
The Cumulative Volume Index (CVI) is a tool used to assess whether money is entering or leaving the market. It’s calculated by adding the number of advancing stocks to the number of declining stocks and then adding the previous period’s CVI value.
To visualize the CVI’s impact, we can refer to a 1-day chart of the Nasdaq 100 index. This graphical representation illustrates whether there has been more trading volume associated with declining stocks or advancing stocks.
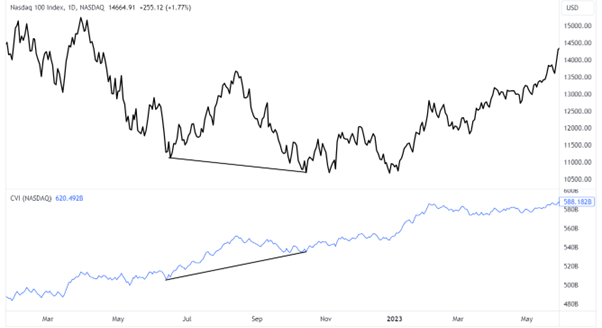
When working with the CVI, it’s essential to identify instances of divergence. This occurs when the trend of an index does not align with the trend of the CVI indicator. In such cases, it is likely that the index will correct or recover itself, moving in the direction indicated by the CVI.
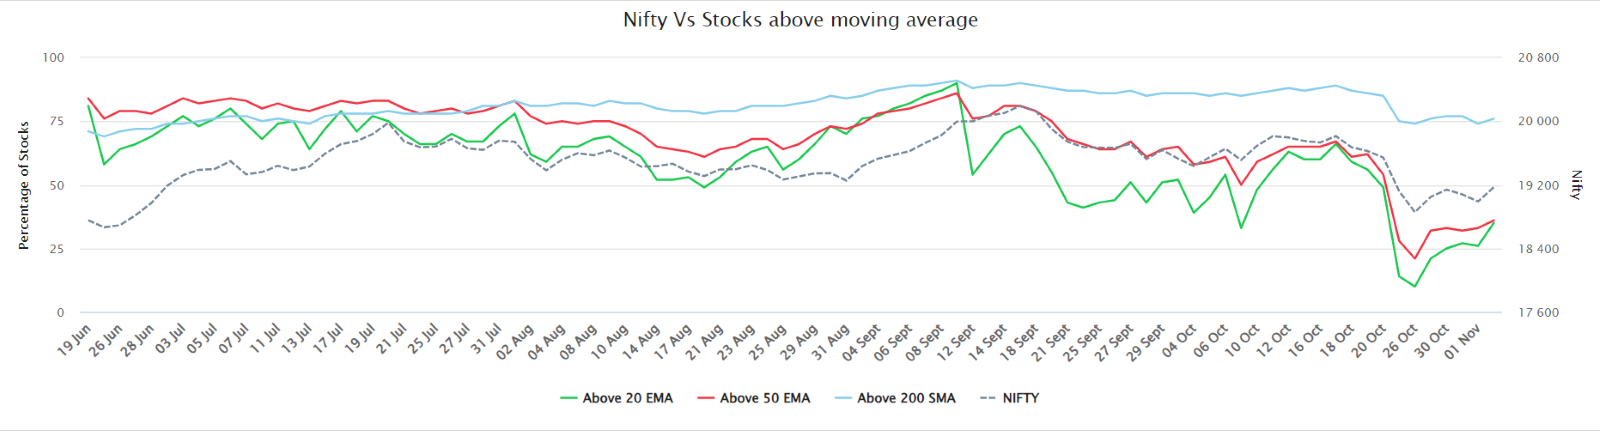
Market breadth, as measured through the percentage of stocks above various moving averages, provides valuable insights into the overall health and direction of a financial market. By tracking the percentage of stocks above key moving averages such as the 20-day, 50-day, and 200-day moving averages (DMA), investors can gauge the market’s underlying strength and potential trends.
When a high percentage of stocks are trading above these moving averages, it suggests a broad-based uptrend and a robust market. Conversely, a low percentage may signal weakness and the potential for a bearish trend. These metrics help traders and investors make informed decisions by providing a snapshot of market sentiment and can be a valuable tool for risk management and investment strategy.
Read: Systematic Trading: Mastering Risk Management and Drawdowns
While indexes offer a glimpse into overall market trends, they are just one piece of the puzzle. To make the most of trading opportunities, it’s essential to gather a broader range of information. Market breadth indicators play a crucial role in supplying this information and can uncover valuable insights that might be overlooked by other traders.
Disclaimer: This blog has been written exclusively for educational purposes. The securities mentioned are only examples and not recommendations. It is based on several secondary sources on the internet and is subject to changes. Please consult an expert before making related decisions.

