


Introduction:
In the ever-changing world of the stock market, fortunes can be made and lost in the blink of an eye. A bullish market rally may seem endless, but history has shown us that even the mightiest bulls can stumble. To thrive as a market participant, it’s imperative to recognize the signs that the tide is turning. In this blog, we unveil an intriguing template that will guide you in identifying the subtle shift from a soaring trend to a downward spiral. By closely monitoring these indicators, you’ll be well-prepared to exit a stock position before it’s too late. After all, as philosopher George Santayana wisely said, “Those who cannot remember the past are condemned to repeat it.”
The Exit Template:
- Distribution Days:
A distribution day is a critical signal, indicating when an index loses over 0.2 percent in a single trading day, accompanied by trading volume greater than the previous session. William O’Neil’s benchmark of 0.2% loss is a key reference. However, an ideal distribution day meets additional criteria: the index closing near its daily low and significantly below its daily high. Moreover, volume should not only surpass the prior trading session but also exceed the 10-day average. When distribution days become a recurrent pattern after a substantial market rise, it’s time to exercise caution. An alarm should be raised when you witness 5-7 distribution days in the span of 10-12 trading sessions.
- Number of Down Days:
Keep a keen eye on the ratio of down days versus up days. Down days signify sessions where the security closes in the red. A red flag is raised when these down days begin to consistently outnumber the up days, overshadowing the positive moves in the market. You might observe a series of selling days with just occasional attempts at recovery. This imbalance is a clear sign that the market sentiment is turning bearish.
- Moving Averages:
Moving averages are invaluable tools for trend identification. During a market under selling pressure, stocks will not leisurely oscillate around key moving averages, such as the 50 or 200-day moving averages. Instead, they tend to experience sharp breaks through these key lines, often accompanied by gap-down openings. Moreover, the breach of a key moving average should be a rare occurrence for it to be considered a significant warning sign.
Illustrative Example: Vakrangee
Let’s examine the case of Vakrangee, a hot stock during the 2016-2017 bull run, when it surged from a low of Rs 90 to over Rs 500. However, cracks began to appear as several consecutive down days surfaced, and the stock broke through its 50-day moving average. Notably, the 50-day moving average, a strong support during the uptrend, was breached for the first time in a long while. What followed was a precipitous decline in the stock’s value, as it melted like ice in the sun.
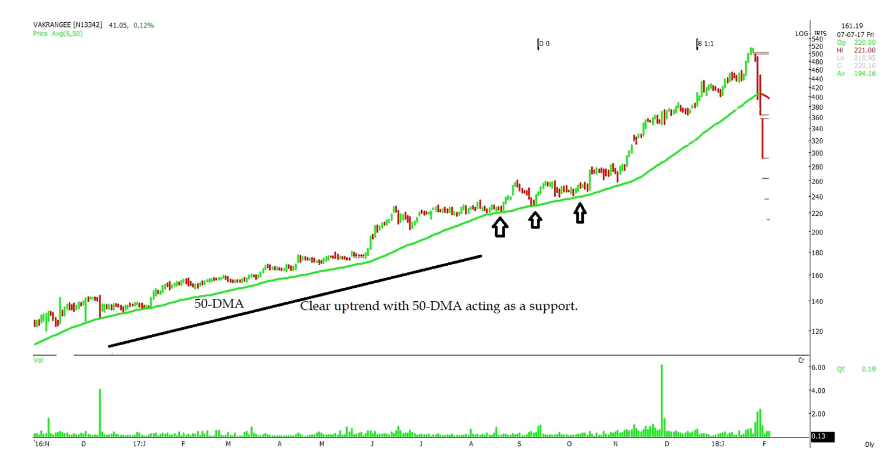 Chart 01

Chart 02
Conclusion:
In the world of stock trading, understanding when to exit a position can be as crucial as knowing when to enter. While we all wish for bull markets to last indefinitely, they inevitably come to an end. By closely monitoring distribution days, tracking the ratio of down days to up days, and paying attention to the behavior of key moving averages, you can make more informed decisions and avoid being caught off guard. Remember, the past holds valuable lessons, and it’s up to you to learn from them and avoid the costly mistakes that come with neglecting history. So, keep your eyes on the market, and be ready to exit when the signs point to a change in the tide. Your financial future may depend on it.

