Everything in life has cycles, like the seasons of the year or the ups and downs of the economy. The same goes for financial markets. Prices of stocks, bonds, and other financial instruments tend to go up and down in predictable patterns over time. This is known as cycle theory.
While cycles can help anticipate future price movements, it’s important to remember they are not foolproof. Just like trends can disappear, so can cycles. Instead of relying solely on cycle analysis, use it alongside other technical analysis tools to get a more complete picture of the market.
The image below depicts a perfect cycle with a duration of 100 days. The first peak occurs at 25 days, while the second occurs at 125 days (125 – 25 = 100). The first cycle low occurs at 75 days, while the second cycle low occurs at 175 days (also 100 days later). The cycle crosses the X-axis at 50, 100, and 150 points, which is every 50 points or half a cycle.

- Crest: Cycle high
- Trough: Cycle low
- Phase: Position of the cycle at a particular point in time (the example cycle is at .95 on day 20)
- Inflection Point: This is where the cycle line crosses the X-axis
- Amplitude: Height of the cycle from X-axis to peak or trough
- Length: Distance between cycle highs or cycle lows
Steps to Find Cycles
- Set Chart on Log Scale
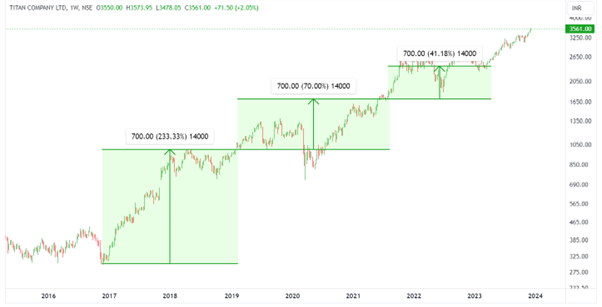
Unlike an arithmetic scale where absolute changes are shown, a log scale displays percentage changes. This allows for a more accurate comparison of price movements, especially over long periods with significant price fluctuations. For instance, a price increase from Rs 300 to Rs 1000 appears much larger than a rise from Rs 1700 to Rs 2400 on a log scale, reflecting their true percentage differences (+233.33% vs. +41.18%). Therefore, using a log scale chart is crucial for a proper analysis of long-term price movements and cycles in the market.
- Smoothing Price
To better understand the underlying trend of the price series, we can filter out the short-term noise by applying a simple moving average (SMA). A short SMA, commonly 5 days, effectively eliminates random fluctuations and reveals the overall direction. This technique is particularly valuable during periods of high volatility, like 2019 to 2022, where it helps identify reliable reaction lows amidst the market turbulence.
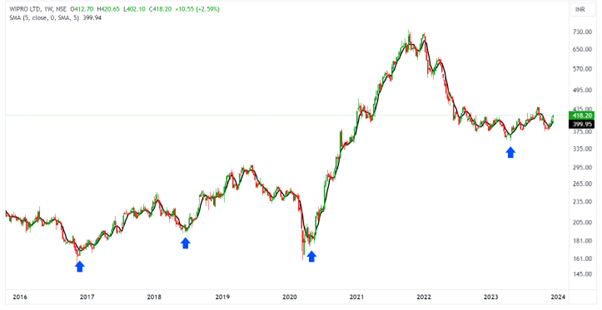
- Examine the charts visually for potential cycle lows. This is possibly the simplest approach to locate cycles. Find a few lows that look to have the same cycle length and prolong that cycle into the future.
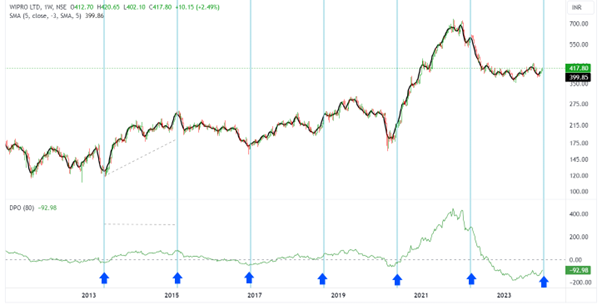
- Detrend the price series to concentrate on cycle lows. The Detrended Price Oscillator (DPO) can be used to detrend. This indicator is based on a centred moving average, or a moving average that has been shifted to the left by a factor of (N/2 + 1). A 20-day DPO is based on a 20-day moving average that has been shifted to the left (past) by 11 days [(20/2 + 1) = 11]. DPO would then be the closing price less the displaced moving average value. The oscillator that results represents price moves above and below the displaced moving average. The oscillator dips can then be used to detect a cycle. Take note that the DPO ends before the final pricing. This is due to the displaced moving average, and the DPO aligns with the displaced moving average.
The Wipro is depicted in the image below using the DPO and Cycle Lines Tool. The chart is displayed in a log scale so that the percentage changes can be seen. Wipro is represented by a 5-day SMA that is 3 days misplaced. The plot will now be in the middle of the moving average period. An 80-week cycle appears to be at work, based on visual examination. As a result, the DPO is set at 80 weeks in order to validate the hypothesised cycle. Every few months, the DPO goes negative, confirming a repeating cycle at work. The blue arrows represent the preliminary estimations for the 80-week cycle. The Cycle Lines Tool is then used to disperse the cycles evenly and project into the future.